| __timestamp | ITT Inc. | Parker-Hannifin Corporation |
|---|---|---|
| Wednesday, January 1, 2014 | 386700000 | 1832903000 |
| Thursday, January 1, 2015 | 402700000 | 1861551000 |
| Friday, January 1, 2016 | 378000000 | 1558088000 |
| Sunday, January 1, 2017 | 415000000 | 1846306000 |
| Monday, January 1, 2018 | 469000000 | 2382235000 |
| Tuesday, January 1, 2019 | 513900000 | 2513468000 |
| Wednesday, January 1, 2020 | 455000000 | 2431500000 |
| Friday, January 1, 2021 | 545600000 | 3092383000 |
| Saturday, January 1, 2022 | 554500000 | 2441242000 |
| Sunday, January 1, 2023 | 639100000 | 4071687000 |
| Monday, January 1, 2024 | 821500000 | 5028229000 |
In pursuit of knowledge
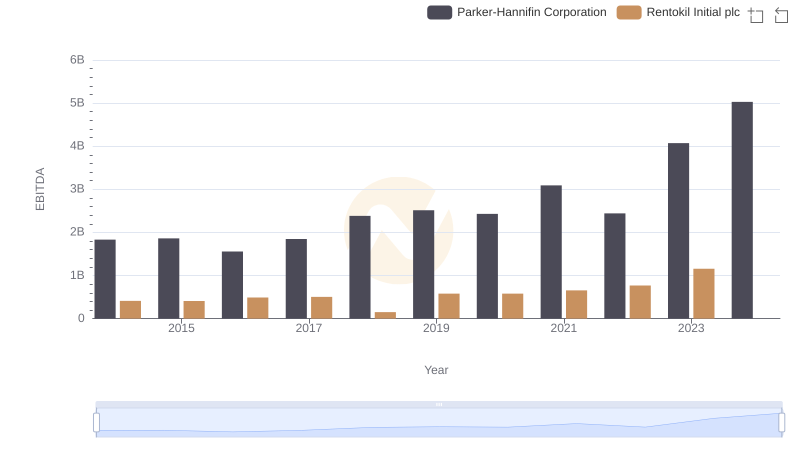
In the ever-evolving landscape of industrial manufacturing, Parker-Hannifin Corporation and ITT Inc. have emerged as key players. Over the past decade, Parker-Hannifin has consistently outperformed ITT Inc. in terms of EBITDA, showcasing a robust growth trajectory. From 2014 to 2023, Parker-Hannifin's EBITDA surged by approximately 122%, peaking at over $4 billion in 2023. In contrast, ITT Inc. experienced a more modest growth of around 65% during the same period, reaching just over $600 million.
This stark contrast highlights Parker-Hannifin's strategic prowess in capitalizing on market opportunities and optimizing operational efficiencies. The data for 2024 is incomplete, but the trend suggests Parker-Hannifin's continued dominance. As the industrial sector braces for future challenges, these insights provide a valuable lens into the financial health and strategic direction of these two industry giants.
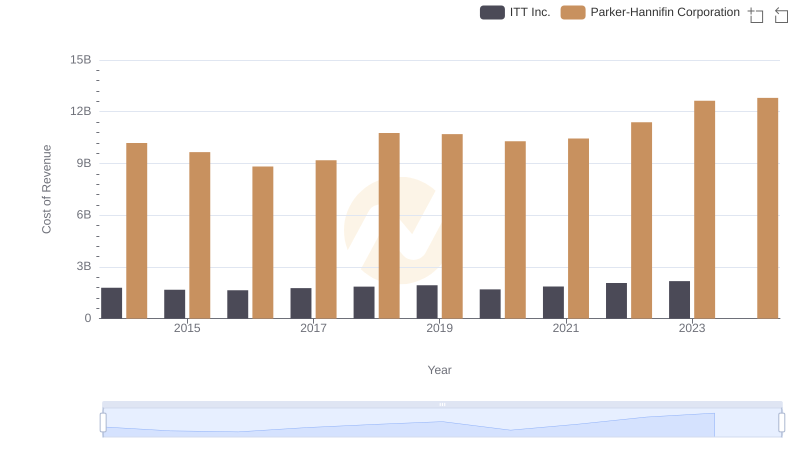
Cost of Revenue Trends: Parker-Hannifin Corporation vs ITT Inc.
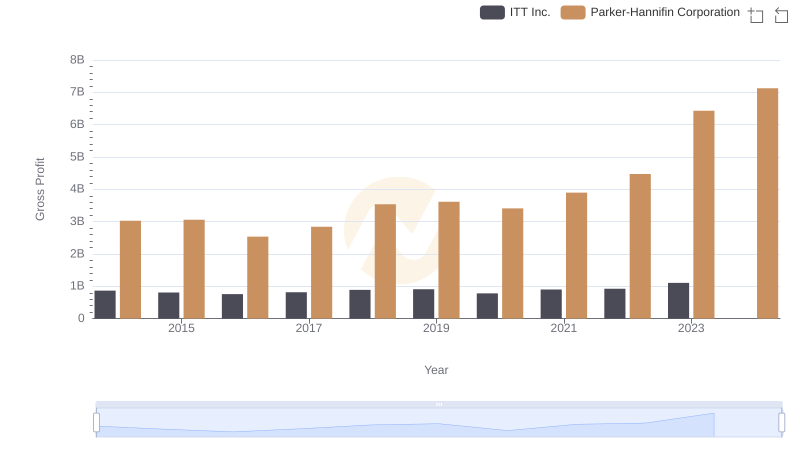
Key Insights on Gross Profit: Parker-Hannifin Corporation vs ITT Inc.
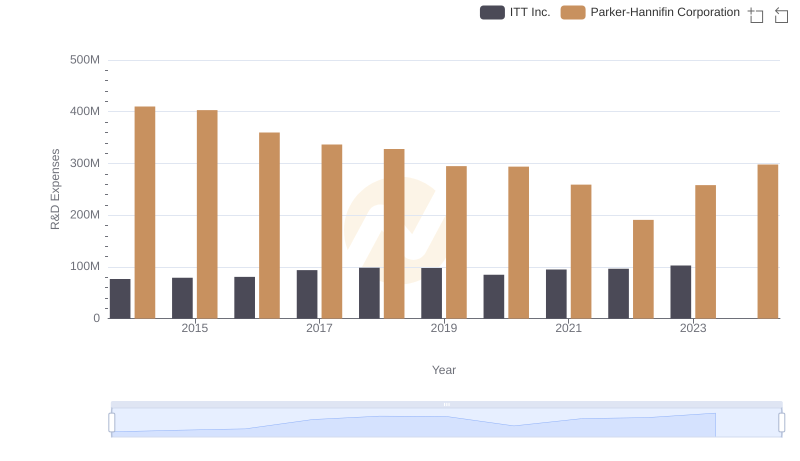
R&D Spending Showdown: Parker-Hannifin Corporation vs ITT Inc.
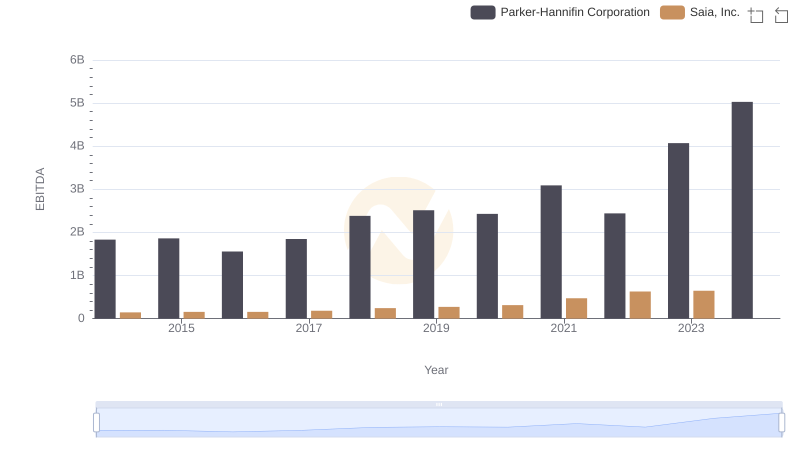
Parker-Hannifin Corporation vs Saia, Inc.: In-Depth EBITDA Performance Comparison
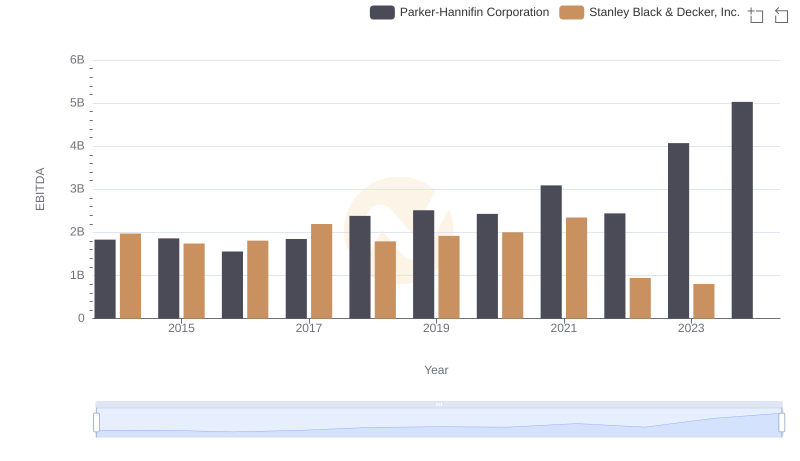
Parker-Hannifin Corporation vs Stanley Black & Decker, Inc.: In-Depth EBITDA Performance Comparison
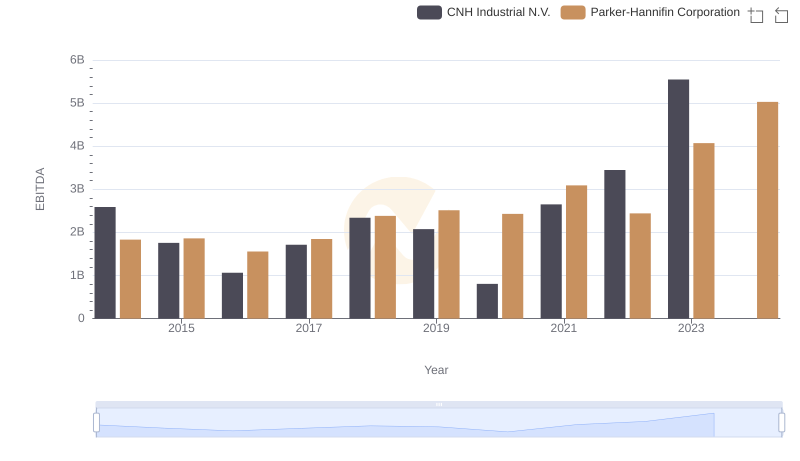
Comprehensive EBITDA Comparison: Parker-Hannifin Corporation vs CNH Industrial N.V.
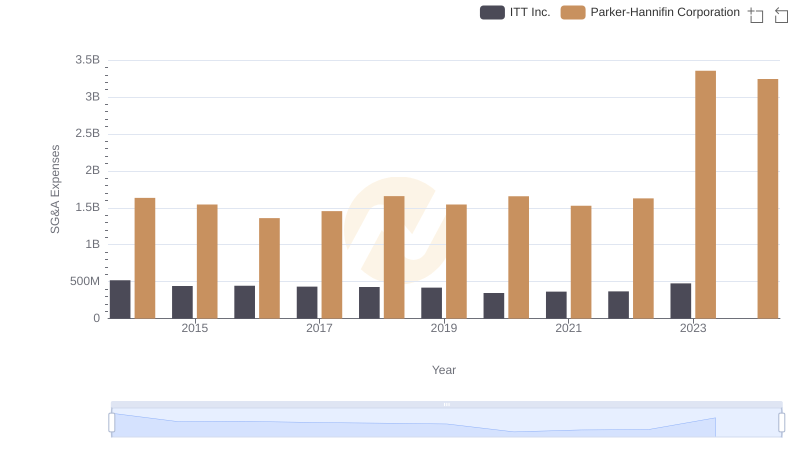
Parker-Hannifin Corporation or ITT Inc.: Who Manages SG&A Costs Better?
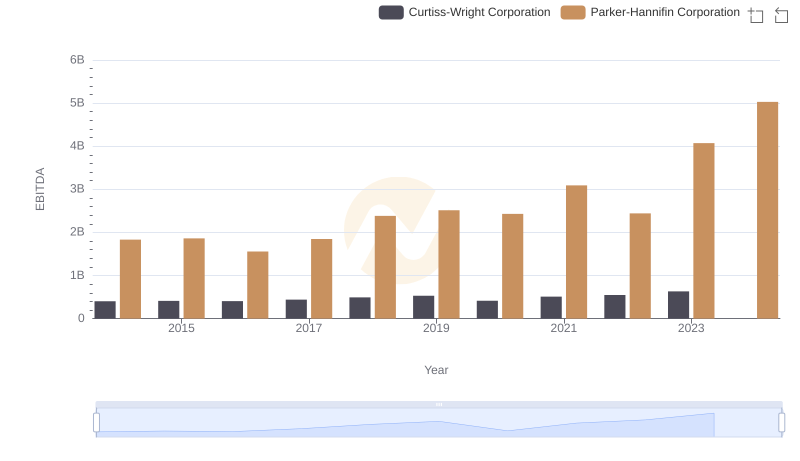
EBITDA Performance Review: Parker-Hannifin Corporation vs Curtiss-Wright Corporation
A Professional Review of EBITDA: Parker-Hannifin Corporation Compared to Rentokil Initial plc