| __timestamp | International Business Machines Corporation | Super Micro Computer, Inc. |
|---|---|---|
| Wednesday, January 1, 2014 | 46386000000 | 1241657000 |
| Thursday, January 1, 2015 | 41057000000 | 1670924000 |
| Friday, January 1, 2016 | 41403000000 | 1884048000 |
| Sunday, January 1, 2017 | 42196000000 | 2171349000 |
| Monday, January 1, 2018 | 42655000000 | 2930498000 |
| Tuesday, January 1, 2019 | 26181000000 | 3004838000 |
| Wednesday, January 1, 2020 | 24314000000 | 2813071000 |
| Friday, January 1, 2021 | 25865000000 | 3022884000 |
| Saturday, January 1, 2022 | 27842000000 | 4396098000 |
| Sunday, January 1, 2023 | 27560000000 | 5840470000 |
| Monday, January 1, 2024 | 27202000000 | 12831125000 |
Cracking the code
In the ever-evolving landscape of technology, the cost of revenue is a critical metric that reflects a company's efficiency and market strategy. Over the past decade, International Business Machines Corporation (IBM) and Super Micro Computer, Inc. (SMCI) have showcased contrasting trends in their cost of revenue. From 2014 to 2024, IBM's cost of revenue has seen a significant decline of approximately 41%, dropping from its peak in 2014. This trend indicates IBM's strategic shift towards more efficient operations and possibly a focus on higher-margin services.
Conversely, SMCI has experienced a remarkable increase of over 900% in the same period, highlighting its aggressive expansion and scaling efforts. This surge suggests a robust growth strategy, positioning SMCI as a formidable player in the tech industry. As we look to the future, these trends offer valuable insights into the strategic directions of these two industry leaders.
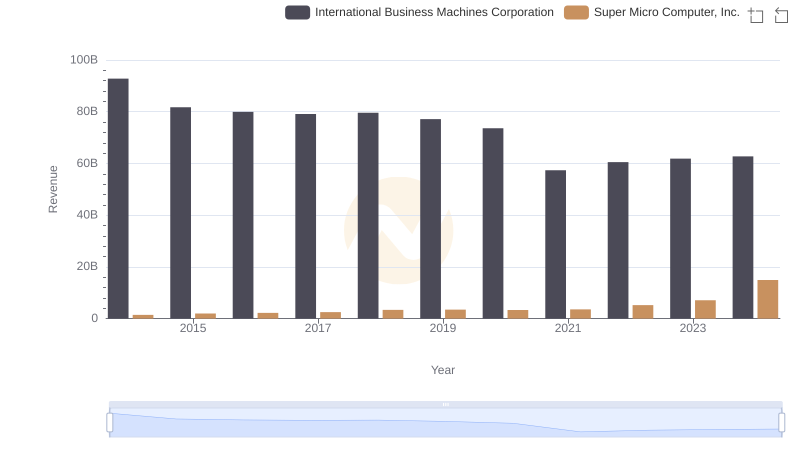
International Business Machines Corporation or Super Micro Computer, Inc.: Who Leads in Yearly Revenue?
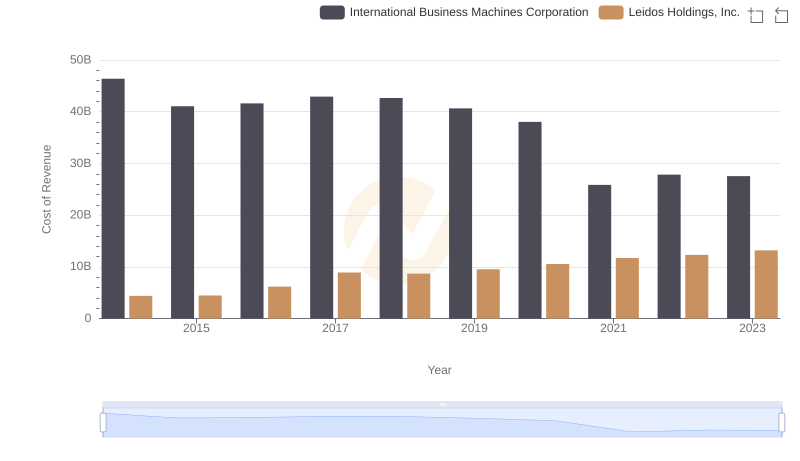
International Business Machines Corporation vs Leidos Holdings, Inc.: Efficiency in Cost of Revenue Explored

Cost of Revenue Trends: International Business Machines Corporation vs Teradyne, Inc.
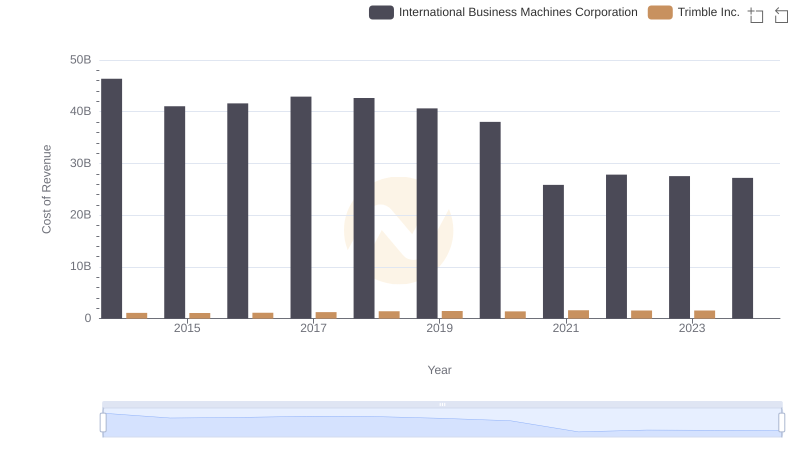
International Business Machines Corporation vs Trimble Inc.: Efficiency in Cost of Revenue Explored
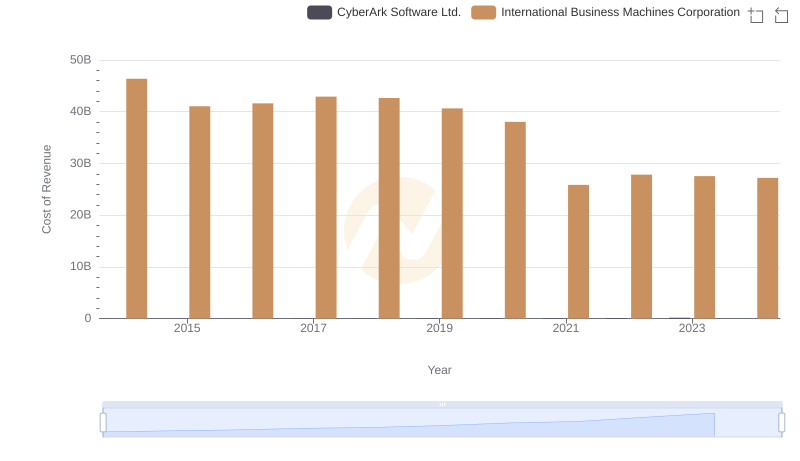
International Business Machines Corporation vs CyberArk Software Ltd.: Efficiency in Cost of Revenue Explored
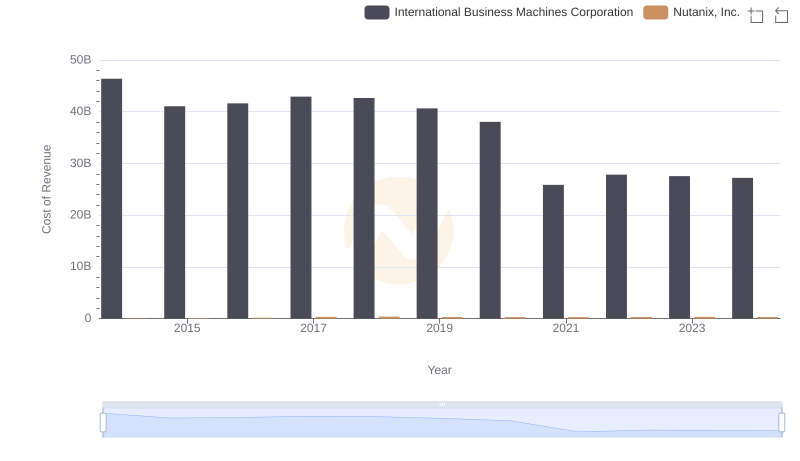
Analyzing Cost of Revenue: International Business Machines Corporation and Nutanix, Inc.
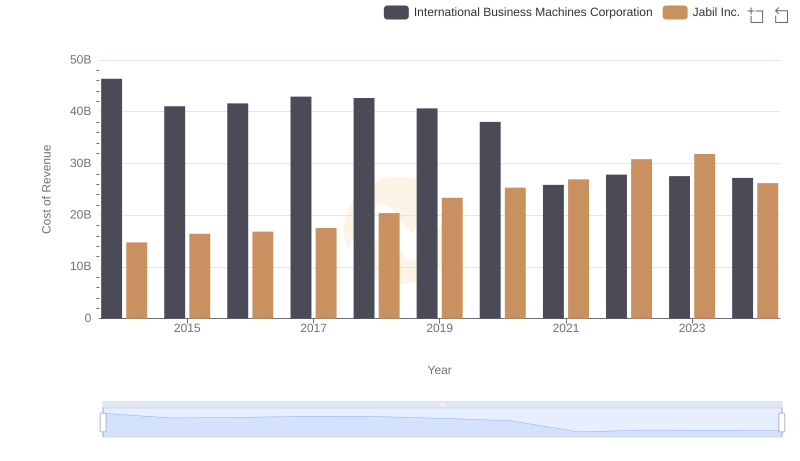
Analyzing Cost of Revenue: International Business Machines Corporation and Jabil Inc.
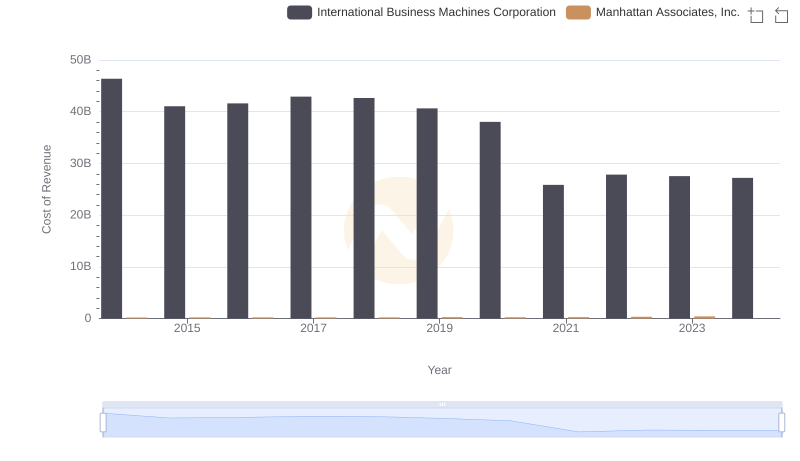
Comparing Cost of Revenue Efficiency: International Business Machines Corporation vs Manhattan Associates, Inc.
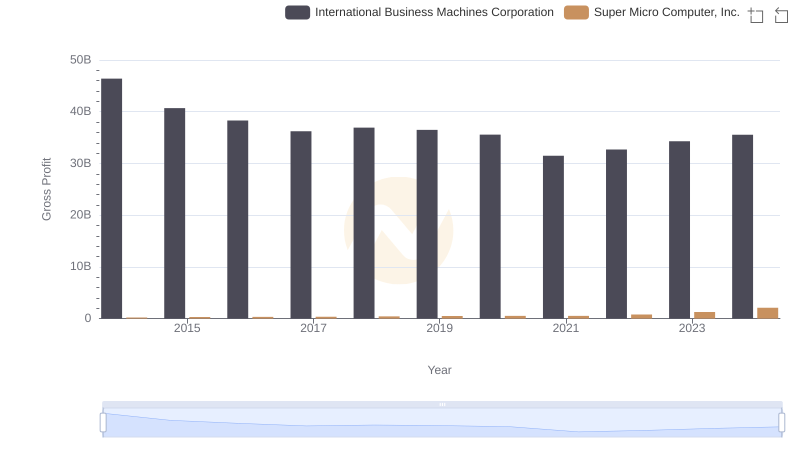
International Business Machines Corporation and Super Micro Computer, Inc.: A Detailed Gross Profit Analysis
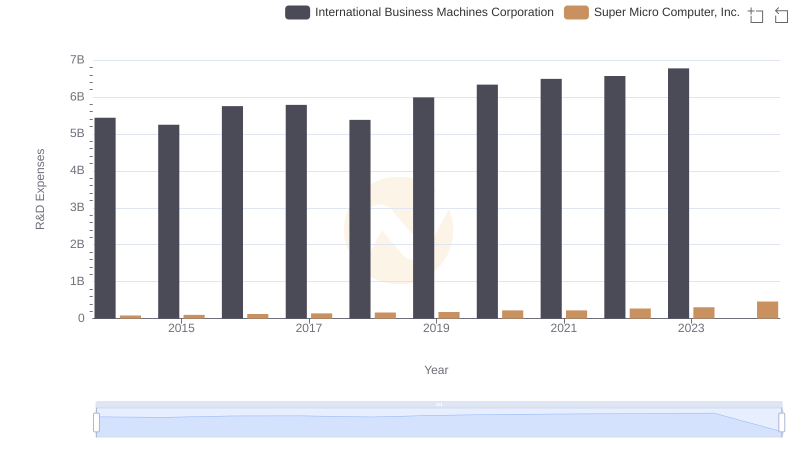
R&D Spending Showdown: International Business Machines Corporation vs Super Micro Computer, Inc.
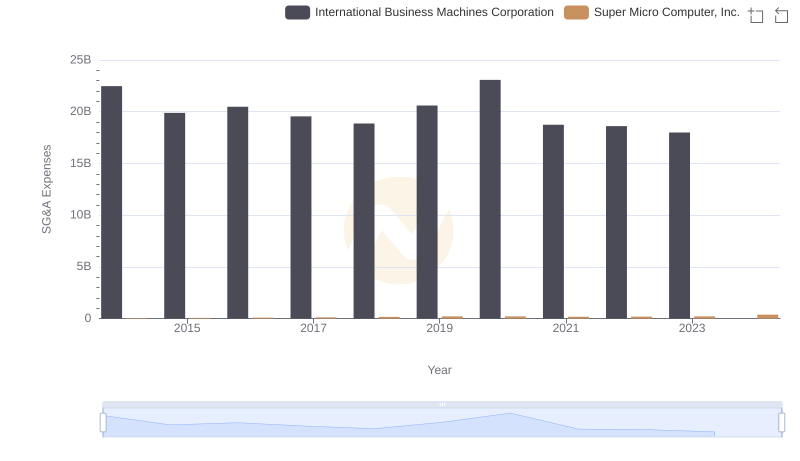
Selling, General, and Administrative Costs: International Business Machines Corporation vs Super Micro Computer, Inc.
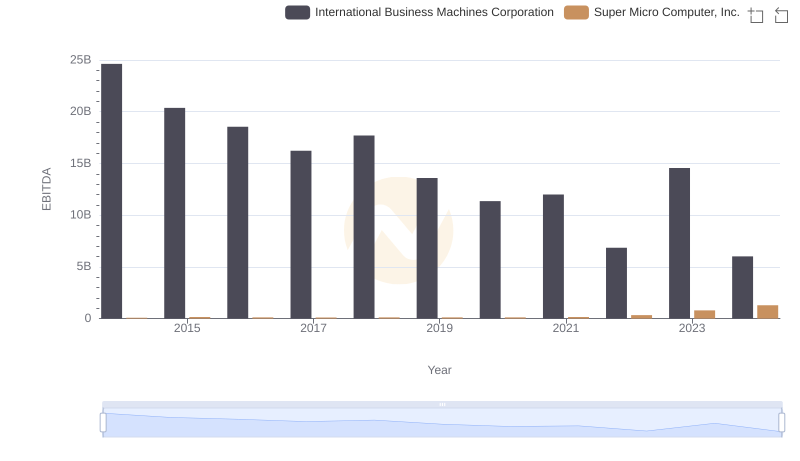
A Side-by-Side Analysis of EBITDA: International Business Machines Corporation and Super Micro Computer, Inc.