| __timestamp | CyberArk Software Ltd. | International Business Machines Corporation |
|---|---|---|
| Wednesday, January 1, 2014 | 14707000 | 46386000000 |
| Thursday, January 1, 2015 | 22660000 | 41057000000 |
| Friday, January 1, 2016 | 30151000 | 41403000000 |
| Sunday, January 1, 2017 | 41848000 | 42196000000 |
| Monday, January 1, 2018 | 48461000 | 42655000000 |
| Tuesday, January 1, 2019 | 62615000 | 26181000000 |
| Wednesday, January 1, 2020 | 82571000 | 24314000000 |
| Friday, January 1, 2021 | 93307000 | 25865000000 |
| Saturday, January 1, 2022 | 126046000 | 27842000000 |
| Sunday, January 1, 2023 | 156131000 | 27560000000 |
| Monday, January 1, 2024 | 215478000 | 27202000000 |
Unleashing insights
In the ever-evolving landscape of technology, cost efficiency remains a pivotal factor for companies striving for profitability. This analysis delves into the cost of revenue trends for International Business Machines Corporation (IBM) and CyberArk Software Ltd. from 2014 to 2023.
Over the past decade, IBM's cost of revenue has seen a gradual decline, dropping from approximately $46 billion in 2014 to around $27 billion in 2023. This represents a significant reduction of nearly 41%, highlighting IBM's strategic efforts to streamline operations and enhance efficiency.
In contrast, CyberArk's cost of revenue has surged by over 960%, from $14.7 million in 2014 to $156 million in 2023. This growth reflects CyberArk's aggressive expansion and investment in securing its market position.
While the data for 2024 is incomplete, the trends suggest continued focus on cost management for both companies. As the tech industry evolves, these insights offer a glimpse into the financial strategies shaping the future.
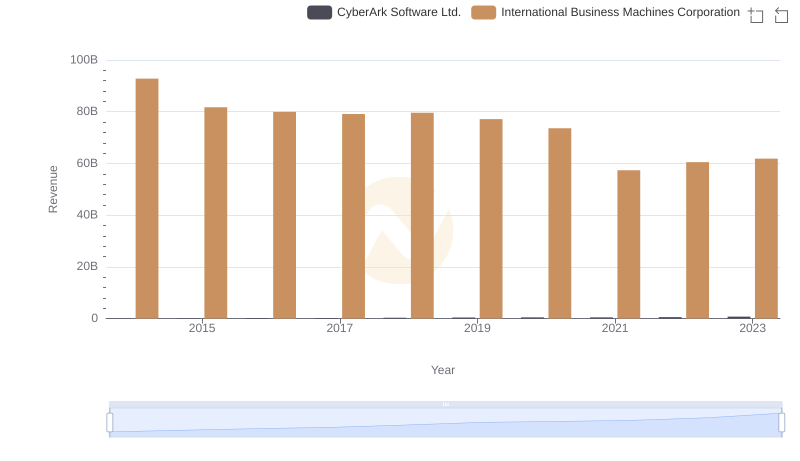
International Business Machines Corporation or CyberArk Software Ltd.: Who Leads in Yearly Revenue?

Cost of Revenue Trends: International Business Machines Corporation vs Teradyne, Inc.
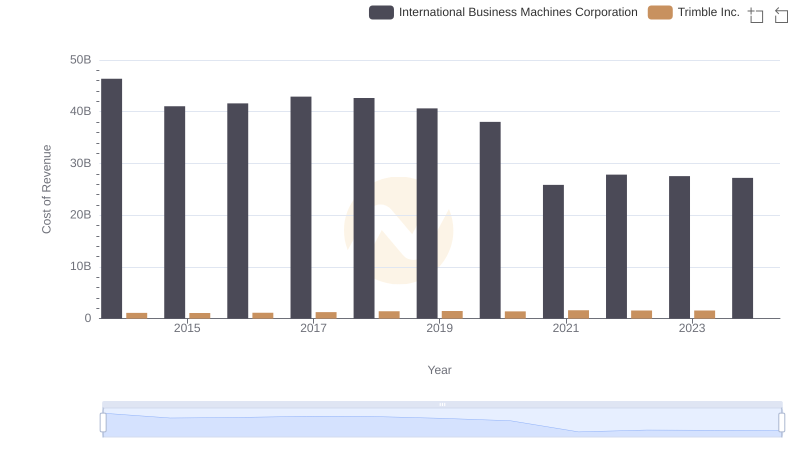
International Business Machines Corporation vs Trimble Inc.: Efficiency in Cost of Revenue Explored
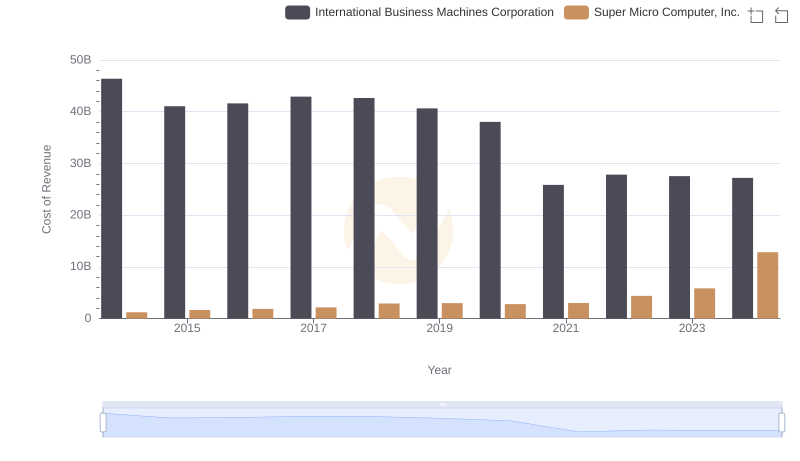
Cost of Revenue Trends: International Business Machines Corporation vs Super Micro Computer, Inc.
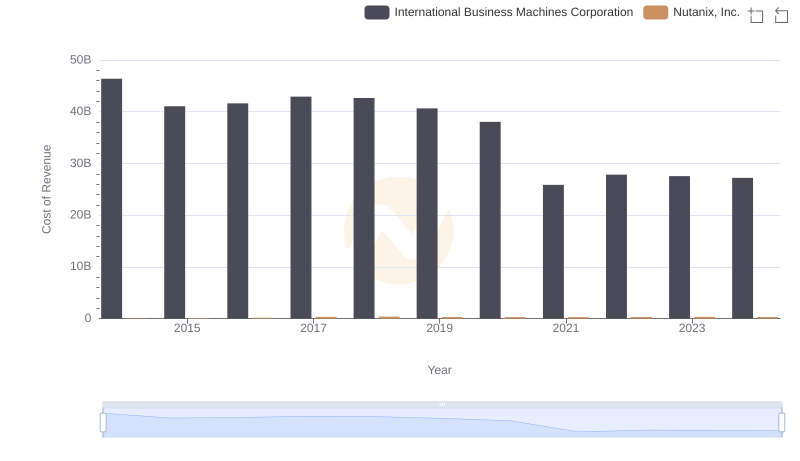
Analyzing Cost of Revenue: International Business Machines Corporation and Nutanix, Inc.
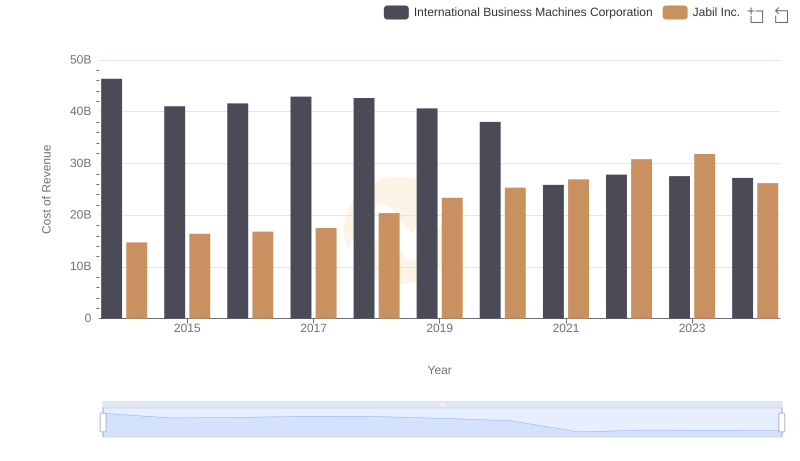
Analyzing Cost of Revenue: International Business Machines Corporation and Jabil Inc.
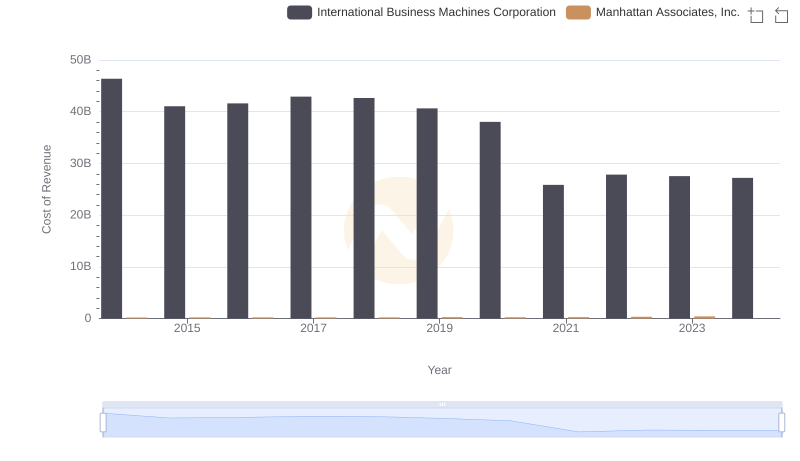
Comparing Cost of Revenue Efficiency: International Business Machines Corporation vs Manhattan Associates, Inc.
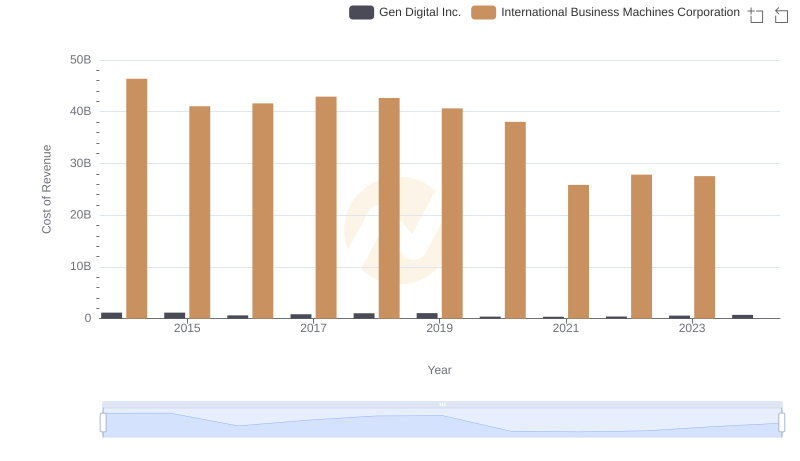
Cost of Revenue Trends: International Business Machines Corporation vs Gen Digital Inc.
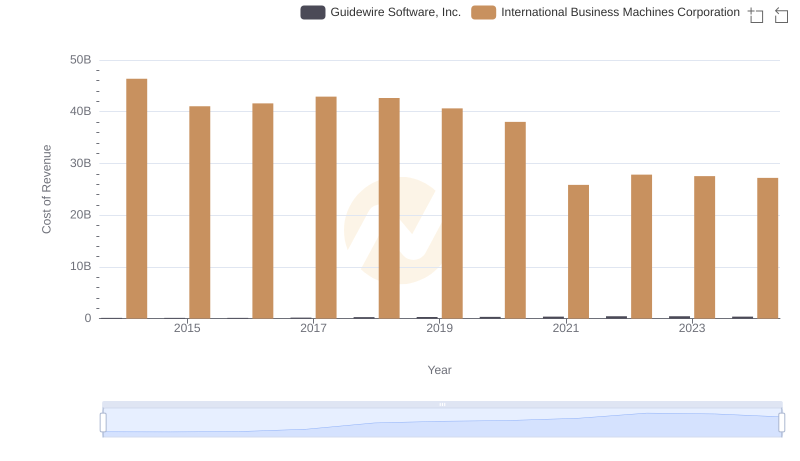
International Business Machines Corporation vs Guidewire Software, Inc.: Efficiency in Cost of Revenue Explored
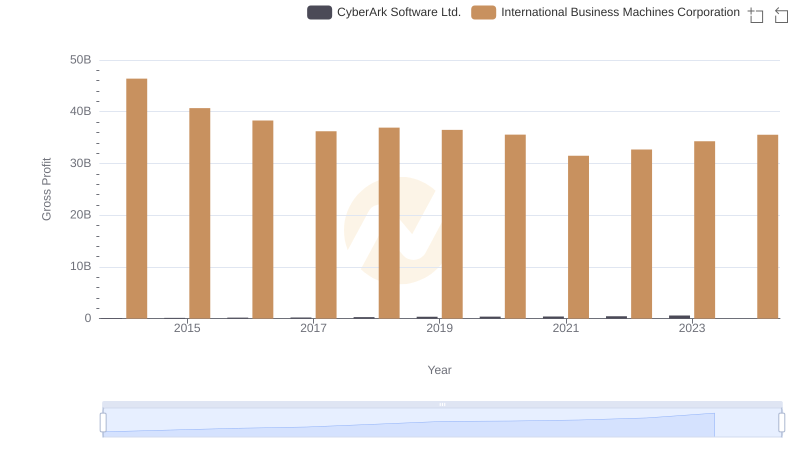
Who Generates Higher Gross Profit? International Business Machines Corporation or CyberArk Software Ltd.
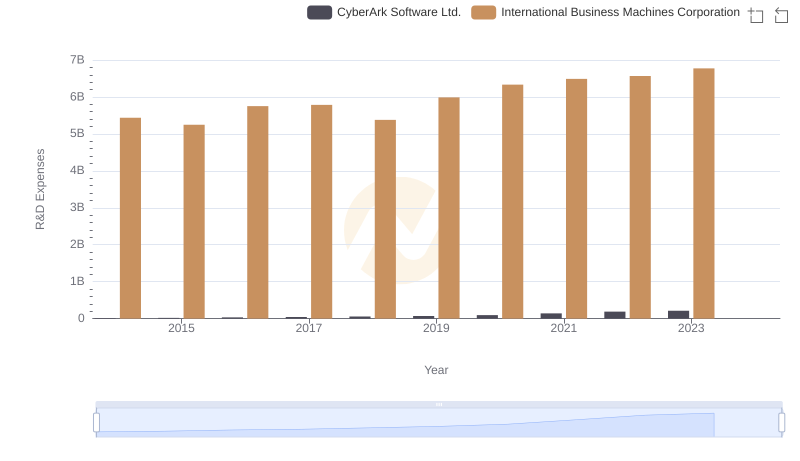
International Business Machines Corporation or CyberArk Software Ltd.: Who Invests More in Innovation?
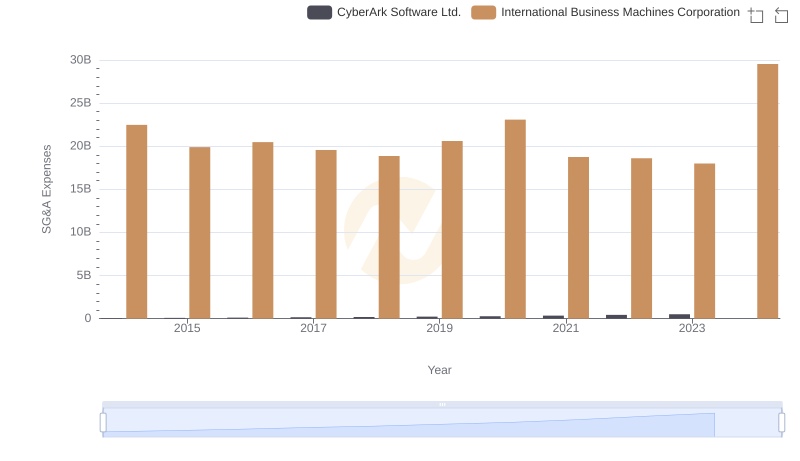
International Business Machines Corporation or CyberArk Software Ltd.: Who Manages SG&A Costs Better?