| __timestamp | International Business Machines Corporation | Nutanix, Inc. |
|---|---|---|
| Wednesday, January 1, 2014 | 46386000000 | 60912000 |
| Thursday, January 1, 2015 | 41057000000 | 100959000 |
| Friday, January 1, 2016 | 41403000000 | 170787000 |
| Sunday, January 1, 2017 | 42196000000 | 327331000 |
| Monday, January 1, 2018 | 42655000000 | 386030000 |
| Tuesday, January 1, 2019 | 26181000000 | 304128000 |
| Wednesday, January 1, 2020 | 24314000000 | 286689000 |
| Friday, January 1, 2021 | 25865000000 | 291906000 |
| Saturday, January 1, 2022 | 27842000000 | 321156000 |
| Sunday, January 1, 2023 | 27560000000 | 332187000 |
| Monday, January 1, 2024 | 27202000000 | 324112000 |
In pursuit of knowledge
In the ever-evolving tech industry, understanding cost structures is crucial for investors and analysts. This chart provides a decade-long comparison of the cost of revenue for International Business Machines Corporation (IBM) and Nutanix, Inc., from 2014 to 2024. IBM, a stalwart in the tech world, has seen its cost of revenue decrease by approximately 41% over this period, from a peak in 2014 to a more streamlined figure in 2024. In contrast, Nutanix, a newer player, has experienced a significant increase of over 400% in its cost of revenue, reflecting its rapid growth and expansion efforts. This divergence highlights the contrasting business models and market strategies of these two companies. As IBM focuses on efficiency, Nutanix is investing heavily in scaling its operations. This analysis offers valuable insights into the financial health and strategic directions of these tech giants.

Cost of Revenue Trends: International Business Machines Corporation vs Teradyne, Inc.
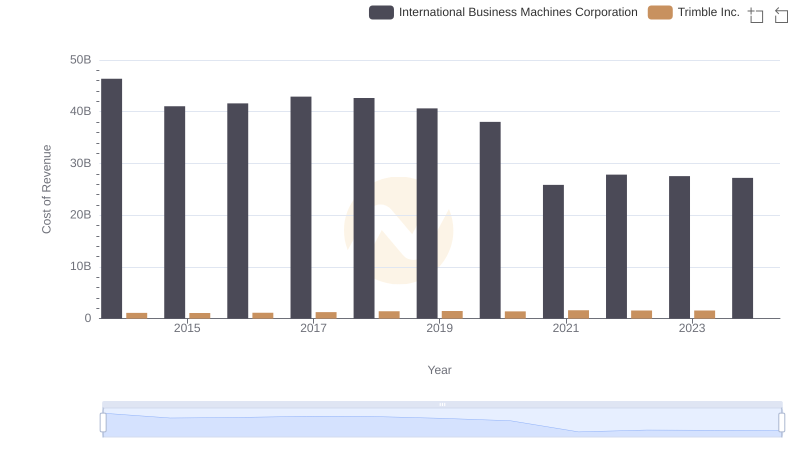
International Business Machines Corporation vs Trimble Inc.: Efficiency in Cost of Revenue Explored
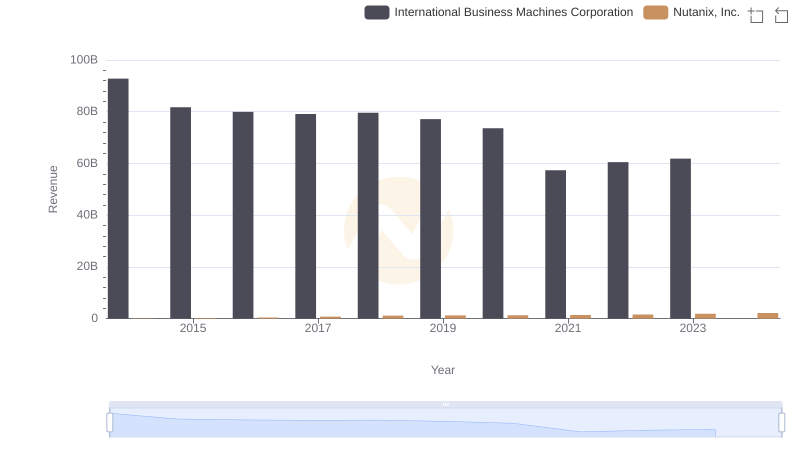
Comparing Revenue Performance: International Business Machines Corporation or Nutanix, Inc.?
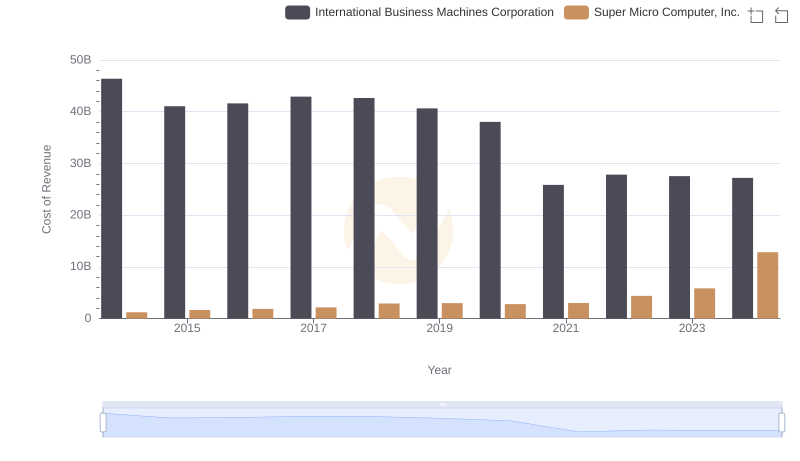
Cost of Revenue Trends: International Business Machines Corporation vs Super Micro Computer, Inc.
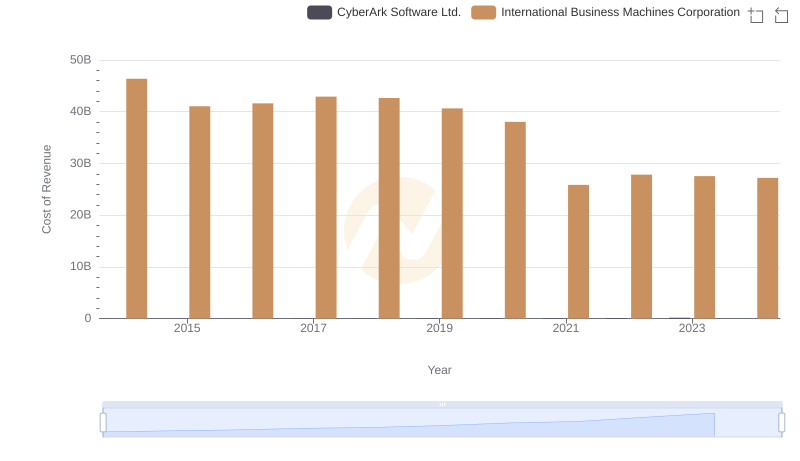
International Business Machines Corporation vs CyberArk Software Ltd.: Efficiency in Cost of Revenue Explored
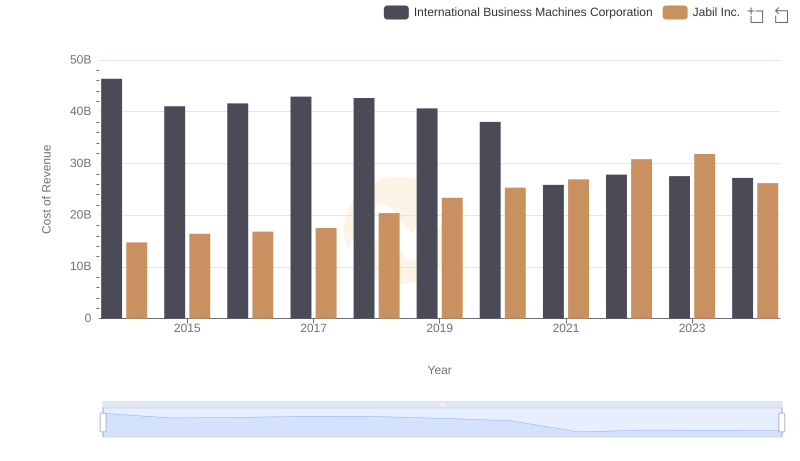
Analyzing Cost of Revenue: International Business Machines Corporation and Jabil Inc.
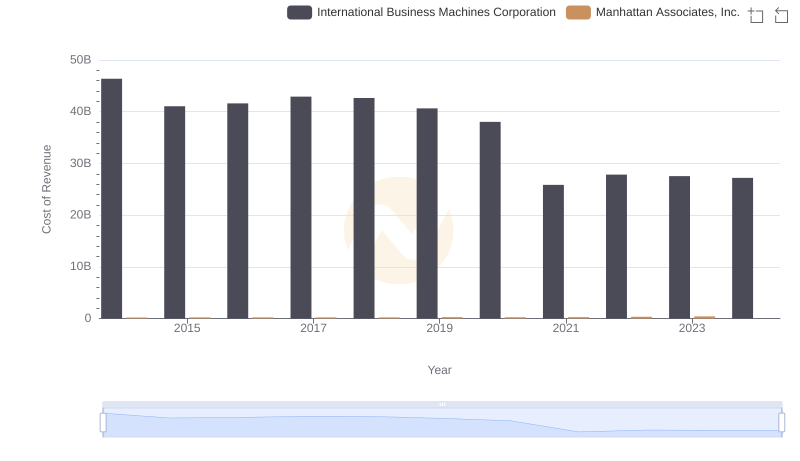
Comparing Cost of Revenue Efficiency: International Business Machines Corporation vs Manhattan Associates, Inc.
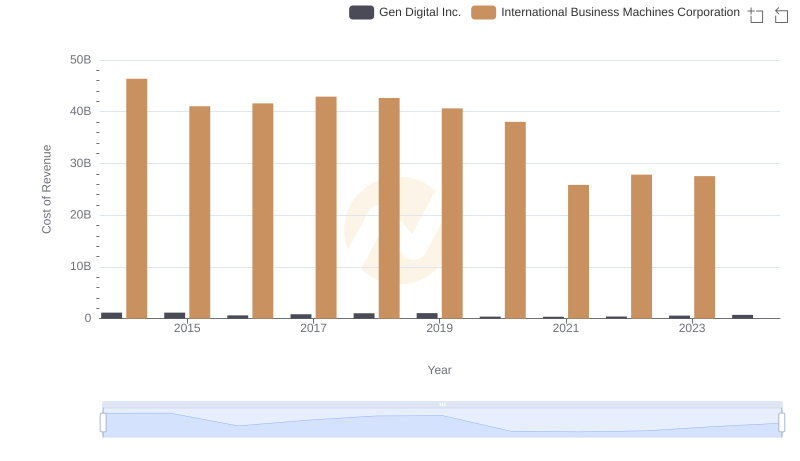
Cost of Revenue Trends: International Business Machines Corporation vs Gen Digital Inc.
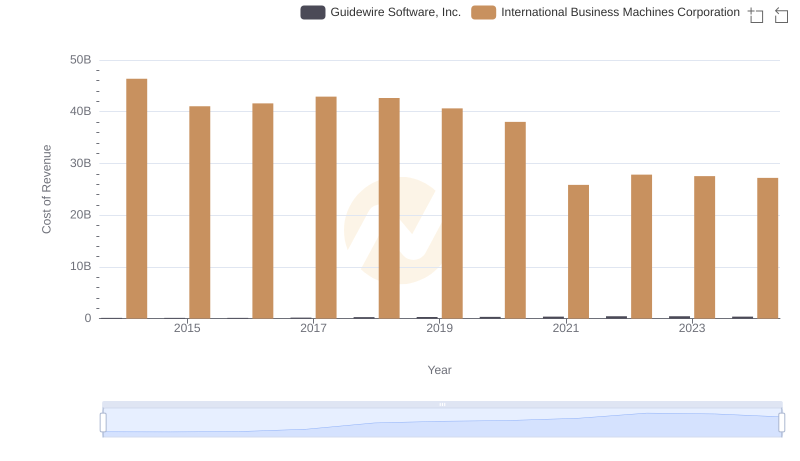
International Business Machines Corporation vs Guidewire Software, Inc.: Efficiency in Cost of Revenue Explored
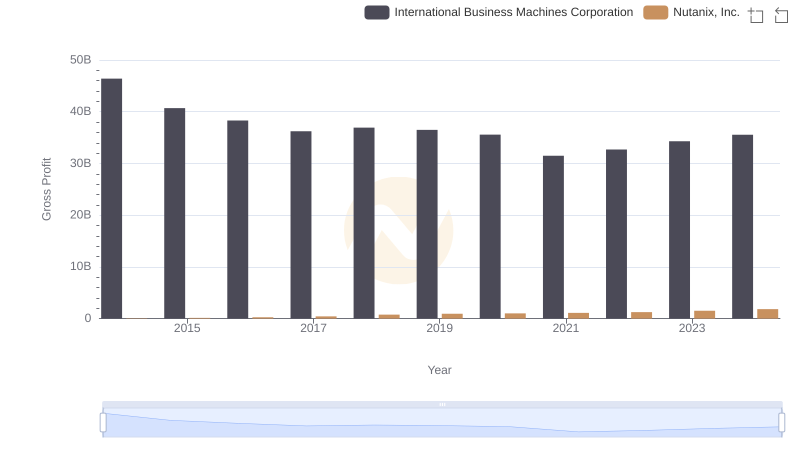
Gross Profit Analysis: Comparing International Business Machines Corporation and Nutanix, Inc.
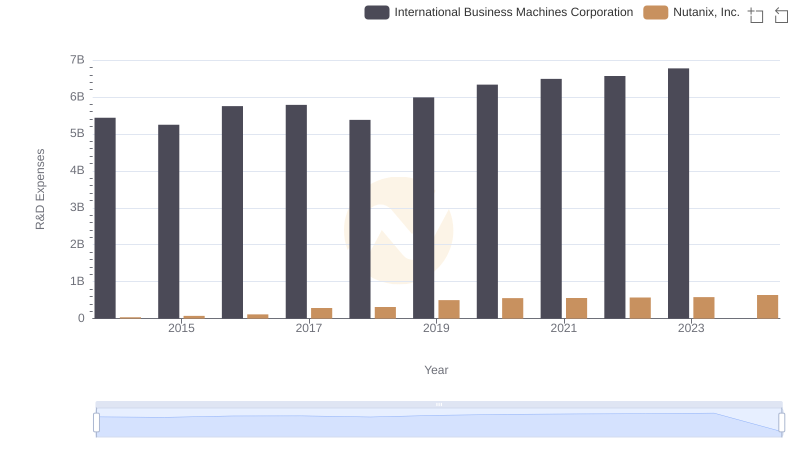
R&D Spending Showdown: International Business Machines Corporation vs Nutanix, Inc.
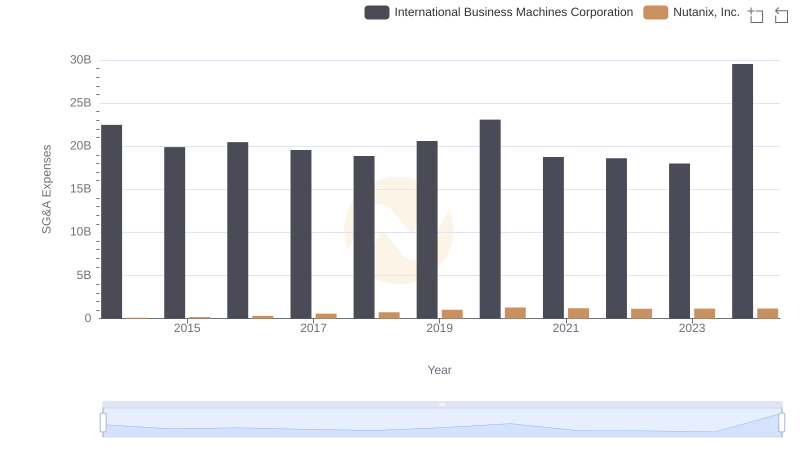
International Business Machines Corporation and Nutanix, Inc.: SG&A Spending Patterns Compared