| __timestamp | International Business Machines Corporation | Sony Group Corporation |
|---|---|---|
| Wednesday, January 1, 2014 | 46386000000 | 5956211000000 |
| Thursday, January 1, 2015 | 41057000000 | 6158134000000 |
| Friday, January 1, 2016 | 41403000000 | 6074652000000 |
| Sunday, January 1, 2017 | 42196000000 | 5663154000000 |
| Monday, January 1, 2018 | 42655000000 | 6230422000000 |
| Tuesday, January 1, 2019 | 26181000000 | 6263196000000 |
| Wednesday, January 1, 2020 | 24314000000 | 5925049000000 |
| Friday, January 1, 2021 | 25865000000 | 6561559000000 |
| Saturday, January 1, 2022 | 27842000000 | 7219841000000 |
| Sunday, January 1, 2023 | 27560000000 | 8398931000000 |
| Monday, January 1, 2024 | 27202000000 | 9695687000000 |
Igniting the spark of knowledge
In the ever-evolving landscape of global business, understanding the cost of revenue is crucial for evaluating a company's financial health. This analysis focuses on International Business Machines Corporation (IBM) and Sony Group Corporation, two giants in the tech and entertainment industries, respectively. From 2014 to 2024, IBM's cost of revenue has seen a significant decline, dropping by approximately 41%, from $46.4 billion to $27.2 billion. This trend reflects IBM's strategic shift towards more efficient operations and a focus on high-margin services.
Conversely, Sony's cost of revenue has surged by around 63% over the same period, reaching nearly $9.7 trillion in 2024. This increase underscores Sony's aggressive expansion in electronics and entertainment sectors. The contrasting trends between these two corporations highlight their distinct strategic directions and market responses, offering valuable insights for investors and industry analysts alike.
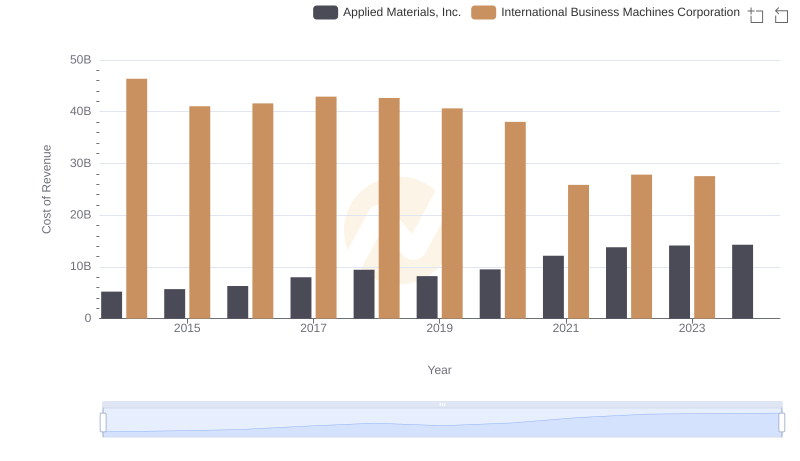
Cost of Revenue: Key Insights for International Business Machines Corporation and Applied Materials, Inc.
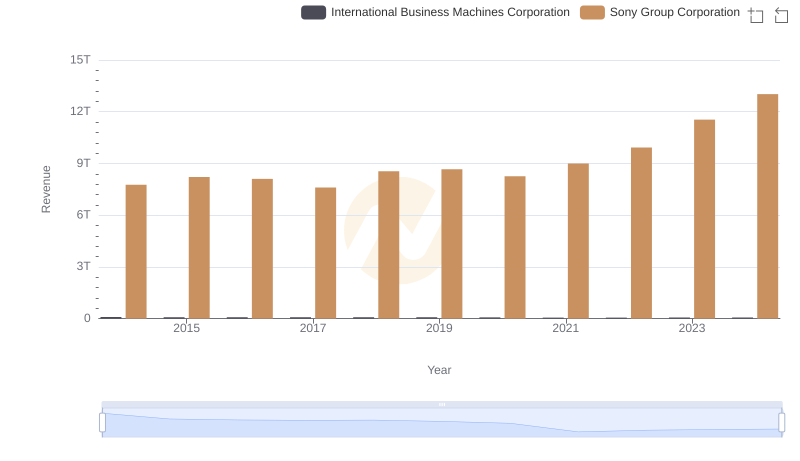
International Business Machines Corporation vs Sony Group Corporation: Annual Revenue Growth Compared
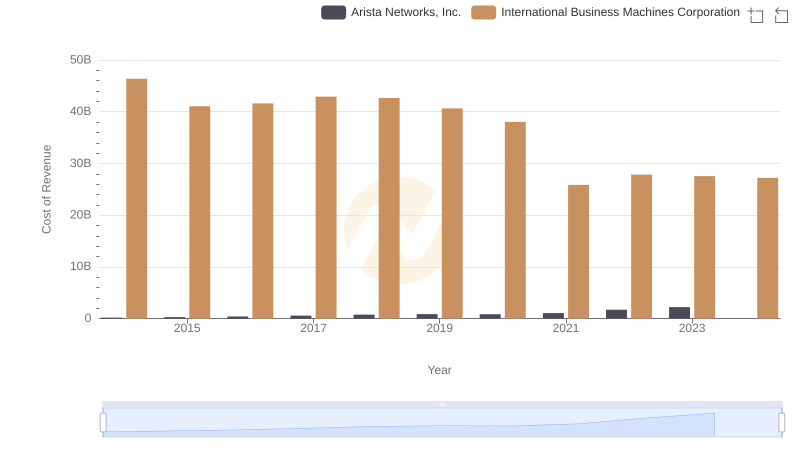
Analyzing Cost of Revenue: International Business Machines Corporation and Arista Networks, Inc.
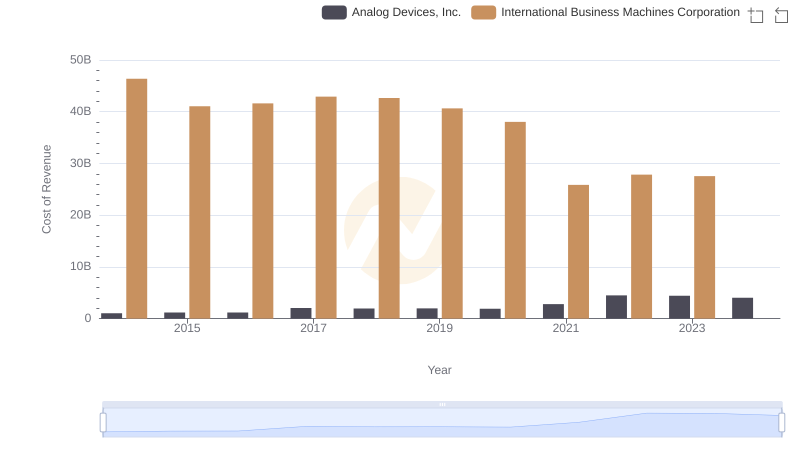
Comparing Cost of Revenue Efficiency: International Business Machines Corporation vs Analog Devices, Inc.
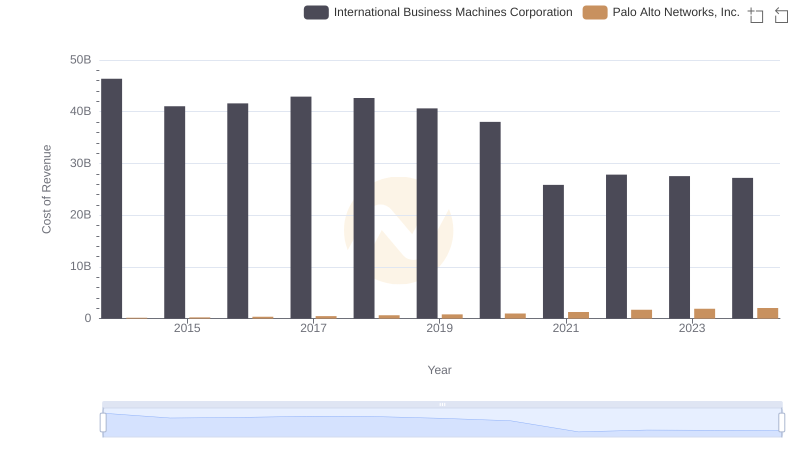
Comparing Cost of Revenue Efficiency: International Business Machines Corporation vs Palo Alto Networks, Inc.
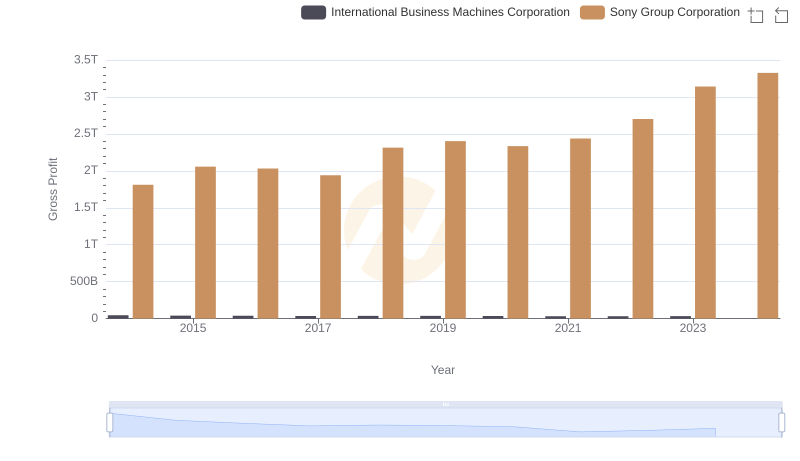
Who Generates Higher Gross Profit? International Business Machines Corporation or Sony Group Corporation
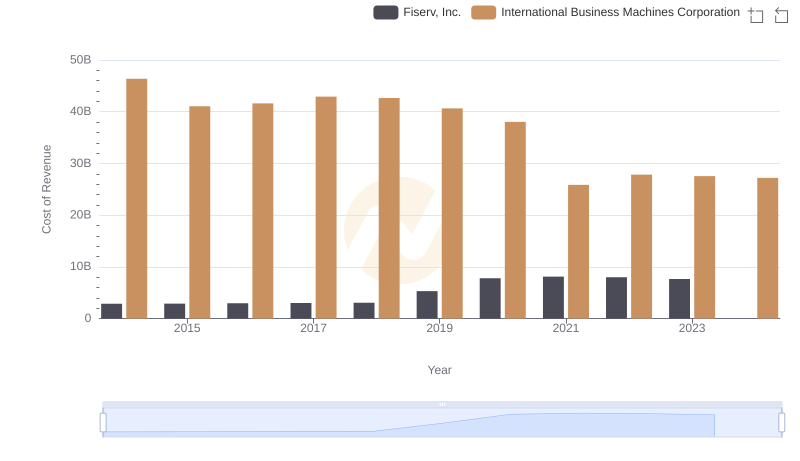
Analyzing Cost of Revenue: International Business Machines Corporation and Fiserv, Inc.
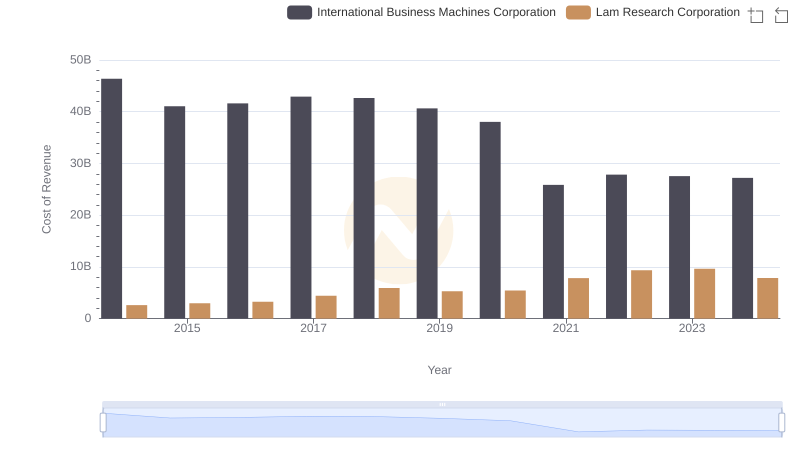
Analyzing Cost of Revenue: International Business Machines Corporation and Lam Research Corporation
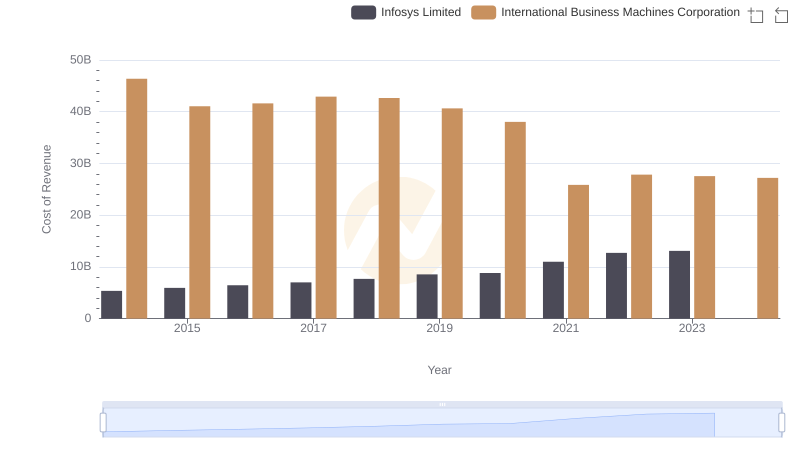
International Business Machines Corporation vs Infosys Limited: Efficiency in Cost of Revenue Explored
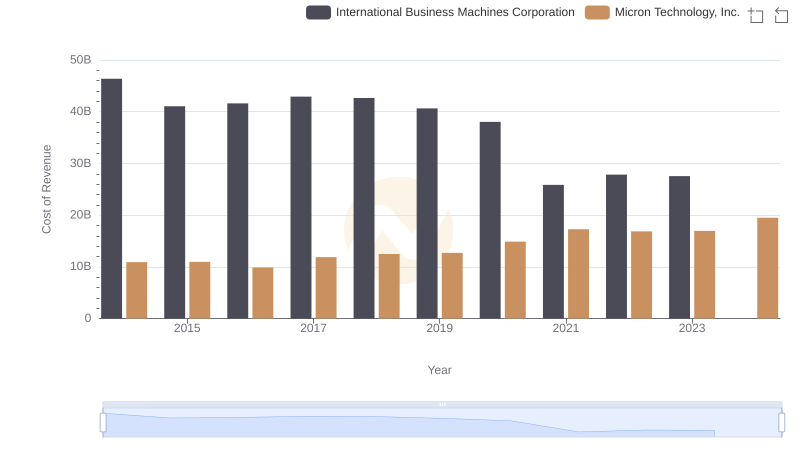
Cost of Revenue: Key Insights for International Business Machines Corporation and Micron Technology, Inc.
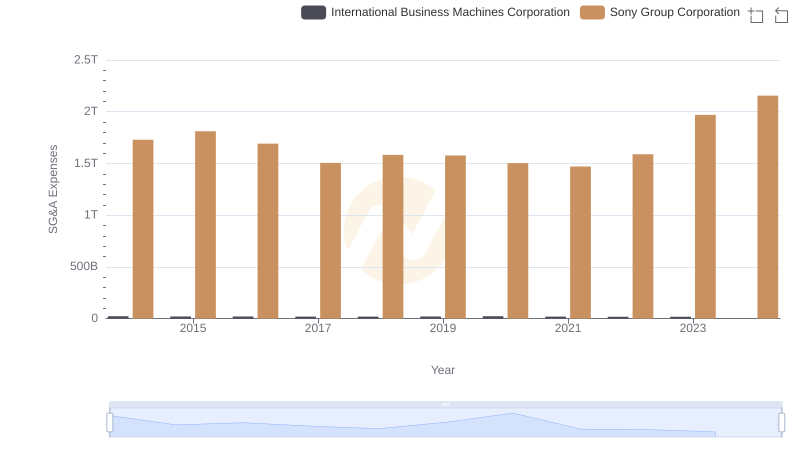
Who Optimizes SG&A Costs Better? International Business Machines Corporation or Sony Group Corporation