| __timestamp | Infosys Limited | Workday, Inc. |
|---|---|---|
| Wednesday, January 1, 2014 | 5374000000 | 176810000 |
| Thursday, January 1, 2015 | 5950000000 | 264803000 |
| Friday, January 1, 2016 | 6446000000 | 374427000 |
| Sunday, January 1, 2017 | 7001000000 | 483545000 |
| Monday, January 1, 2018 | 7687000000 | 629413000 |
| Tuesday, January 1, 2019 | 8552000000 | 834950000 |
| Wednesday, January 1, 2020 | 8828000000 | 1065258000 |
| Friday, January 1, 2021 | 10996000000 | 1198132000 |
| Saturday, January 1, 2022 | 12709000000 | 1428095000 |
| Sunday, January 1, 2023 | 13096000000 | 1715178000 |
| Monday, January 1, 2024 | 1771000000 |
Cracking the code
In the ever-evolving landscape of technology, understanding cost dynamics is crucial. Infosys Limited and Workday, Inc., two titans in the tech industry, have shown distinct trends in their cost of revenue over the past decade. From 2014 to 2023, Infosys has seen a steady increase, with costs rising by approximately 144%, reflecting its expanding global footprint and service offerings. In contrast, Workday's cost of revenue surged by nearly 870% during the same period, highlighting its aggressive growth strategy in cloud-based enterprise solutions.
These trends offer a glimpse into the strategic priorities and market positioning of these industry leaders.
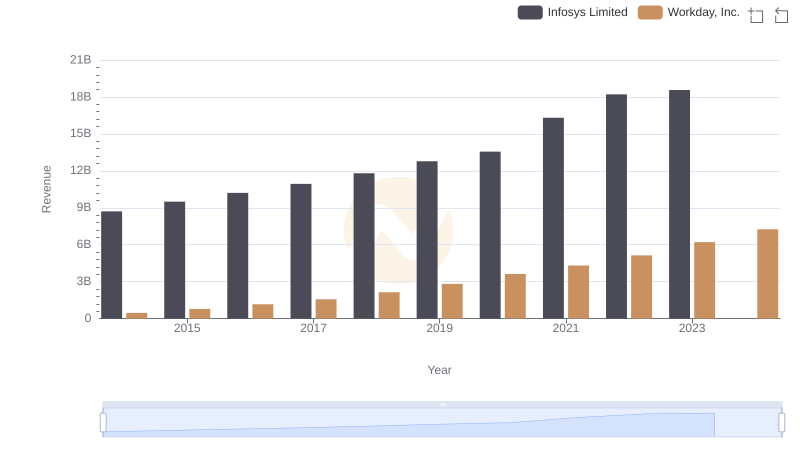
Revenue Showdown: Infosys Limited vs Workday, Inc.
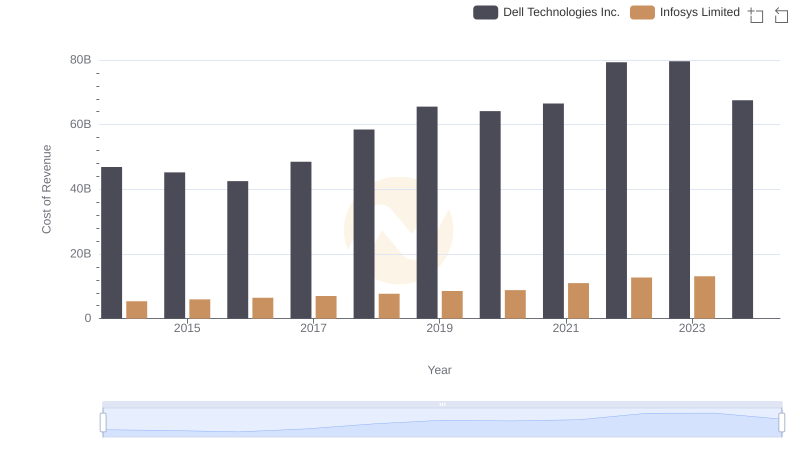
Cost Insights: Breaking Down Infosys Limited and Dell Technologies Inc.'s Expenses
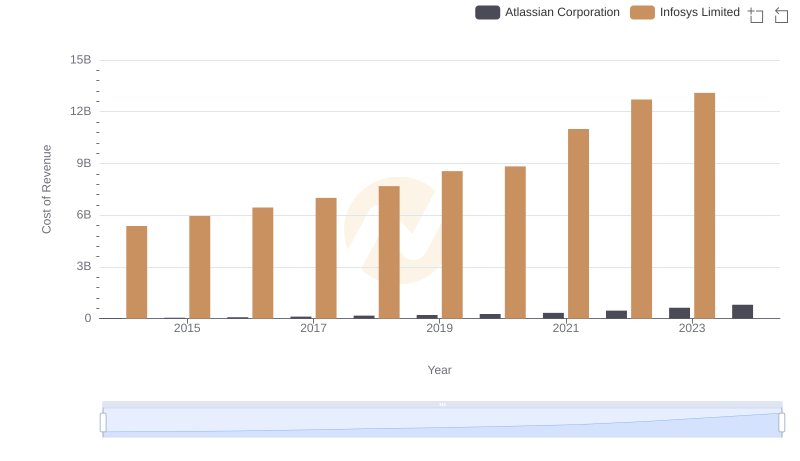
Analyzing Cost of Revenue: Infosys Limited and Atlassian Corporation
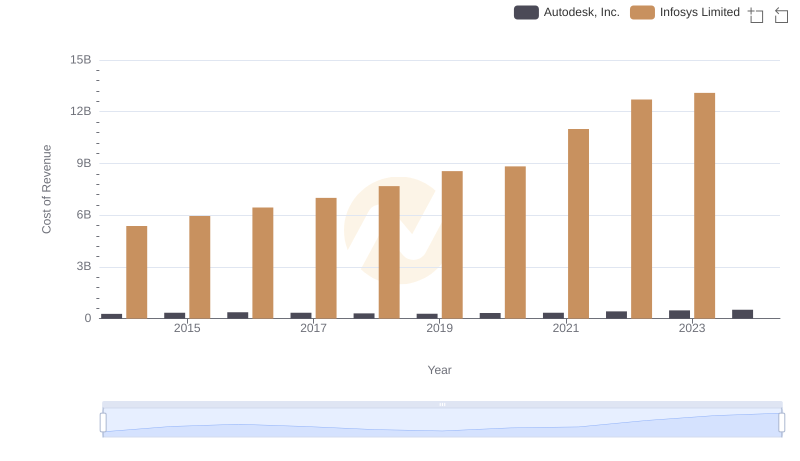
Analyzing Cost of Revenue: Infosys Limited and Autodesk, Inc.
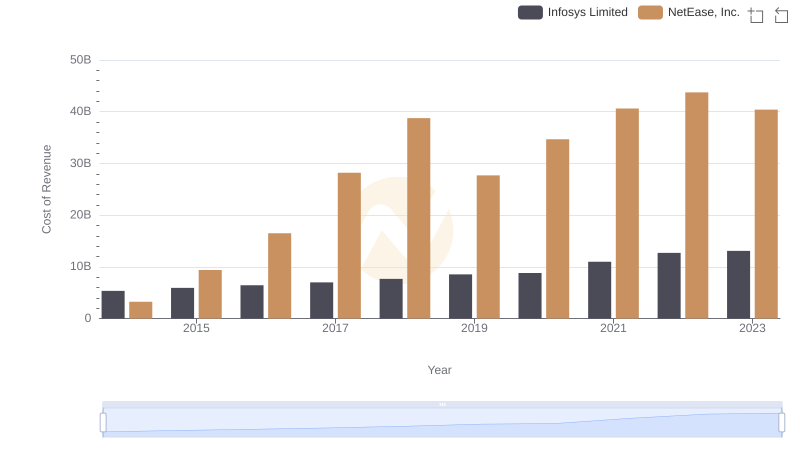
Cost of Revenue Trends: Infosys Limited vs NetEase, Inc.
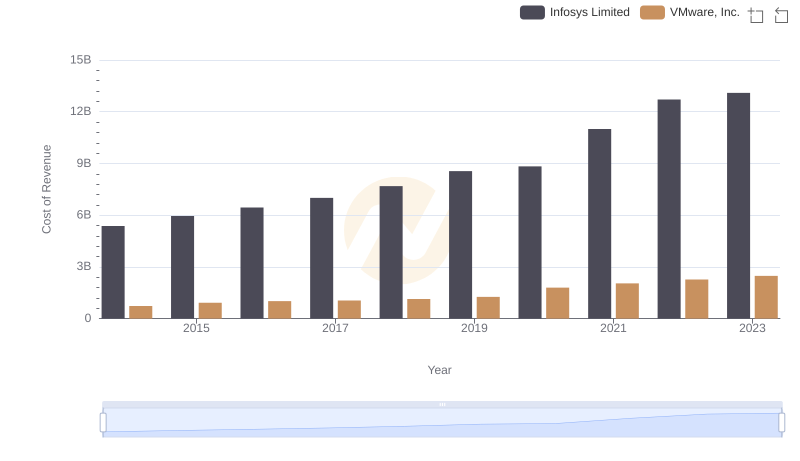
Cost Insights: Breaking Down Infosys Limited and VMware, Inc.'s Expenses
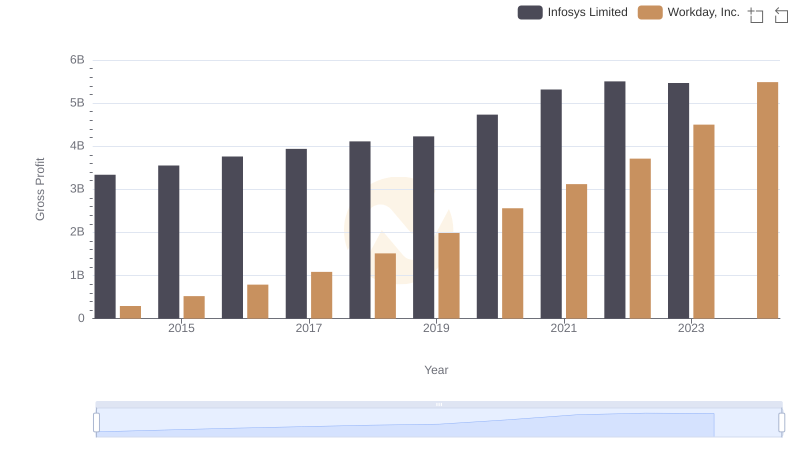
Key Insights on Gross Profit: Infosys Limited vs Workday, Inc.
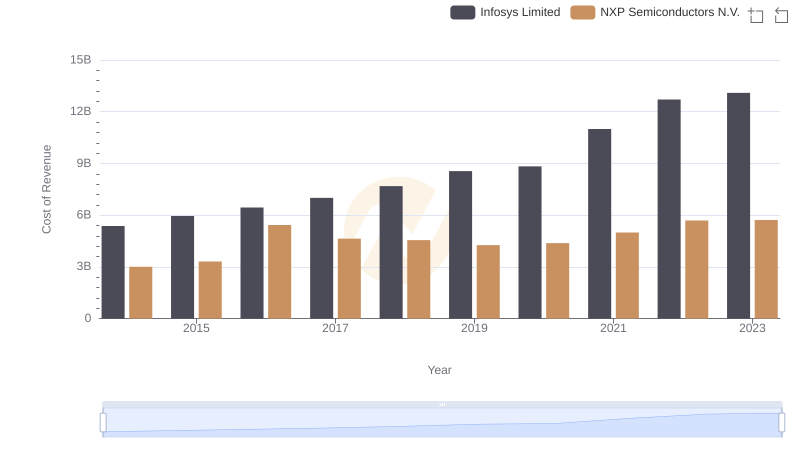
Analyzing Cost of Revenue: Infosys Limited and NXP Semiconductors N.V.
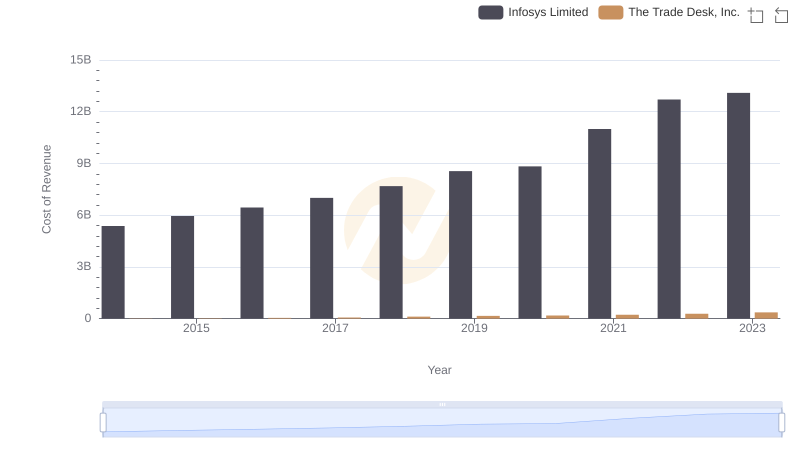
Cost of Revenue: Key Insights for Infosys Limited and The Trade Desk, Inc.
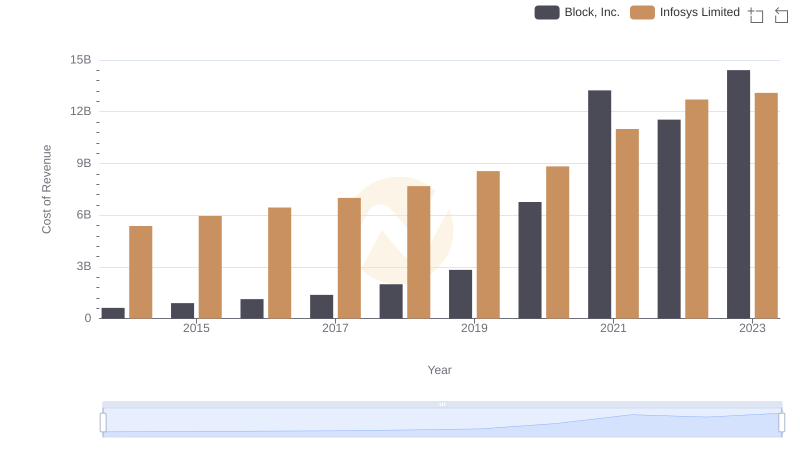
Cost Insights: Breaking Down Infosys Limited and Block, Inc.'s Expenses
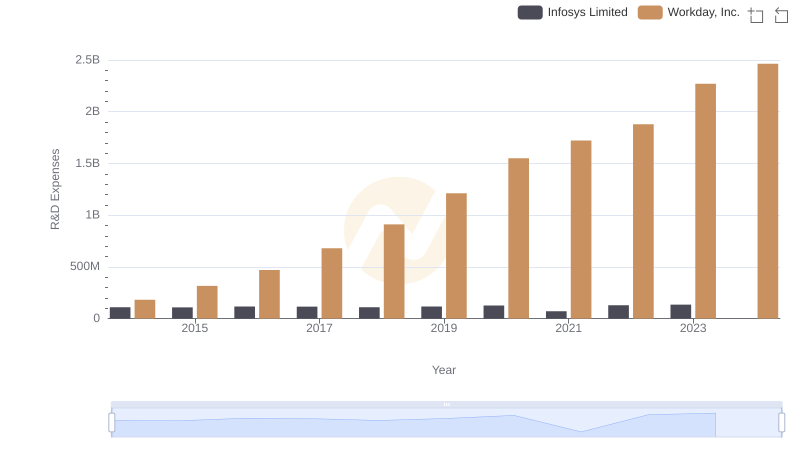
Infosys Limited vs Workday, Inc.: Strategic Focus on R&D Spending
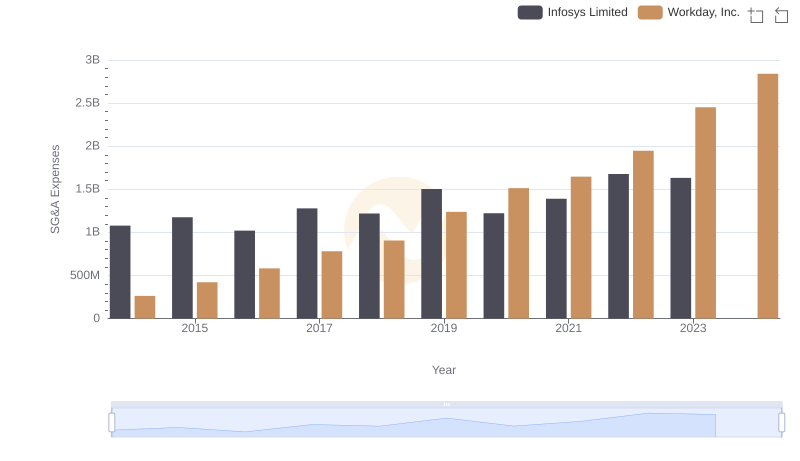
Operational Costs Compared: SG&A Analysis of Infosys Limited and Workday, Inc.