| __timestamp | Infosys Limited | NXP Semiconductors N.V. |
|---|---|---|
| Wednesday, January 1, 2014 | 5374000000 | 3007000000 |
| Thursday, January 1, 2015 | 5950000000 | 3314000000 |
| Friday, January 1, 2016 | 6446000000 | 5429000000 |
| Sunday, January 1, 2017 | 7001000000 | 4637000000 |
| Monday, January 1, 2018 | 7687000000 | 4556000000 |
| Tuesday, January 1, 2019 | 8552000000 | 4259000000 |
| Wednesday, January 1, 2020 | 8828000000 | 4377000000 |
| Friday, January 1, 2021 | 10996000000 | 4996000000 |
| Saturday, January 1, 2022 | 12709000000 | 5688000000 |
| Sunday, January 1, 2023 | 13096000000 | 5723000000 |
Unveiling the hidden dimensions of data
In the ever-evolving landscape of global technology, Infosys Limited and NXP Semiconductors N.V. stand as titans, each with a unique trajectory in managing their cost of revenue. From 2014 to 2023, Infosys Limited has seen a remarkable 144% increase in its cost of revenue, reflecting its expansive growth and strategic investments. In contrast, NXP Semiconductors N.V. has experienced a more modest 90% rise, indicative of its steady yet cautious approach in the semiconductor industry.
Infosys's cost of revenue surged from approximately $5.4 billion in 2014 to over $13 billion in 2023, showcasing its aggressive expansion in IT services. Meanwhile, NXP's cost of revenue grew from around $3 billion to nearly $5.7 billion, highlighting its focus on innovation in semiconductor solutions. This comparative analysis underscores the diverse strategies these companies employ to navigate the competitive tech landscape.
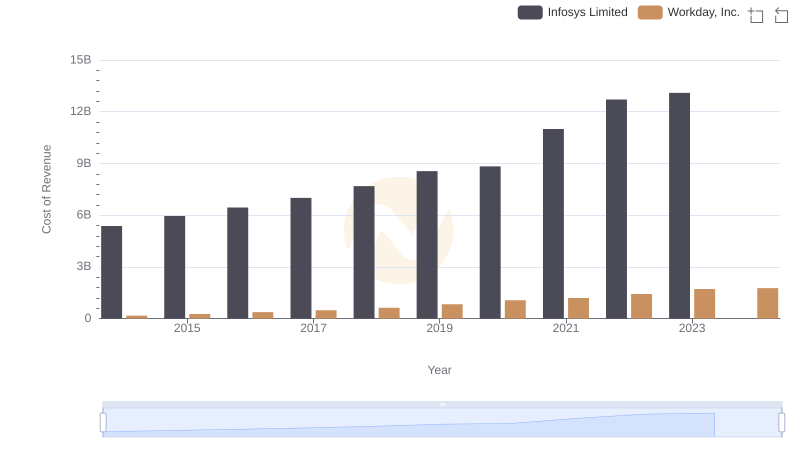
Cost of Revenue Trends: Infosys Limited vs Workday, Inc.
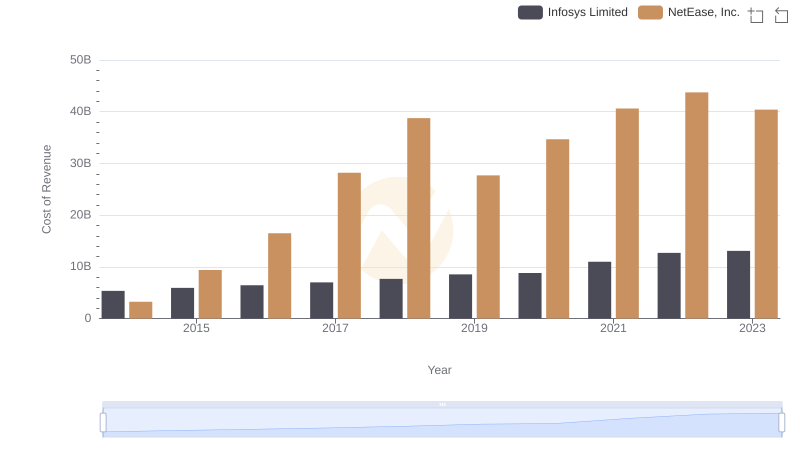
Cost of Revenue Trends: Infosys Limited vs NetEase, Inc.
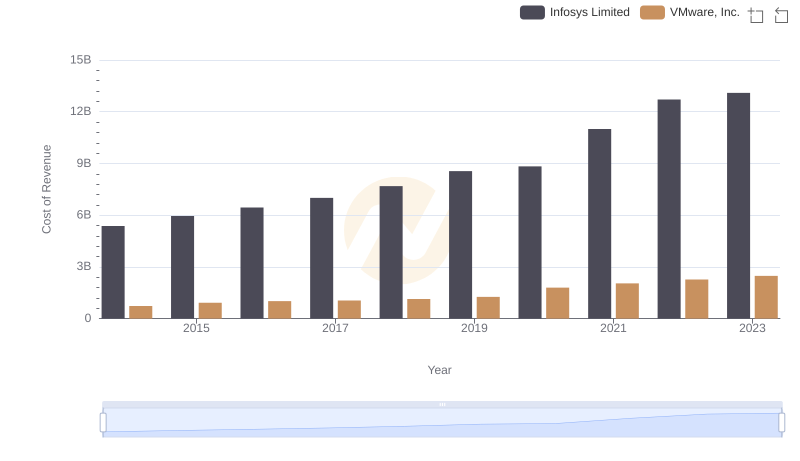
Cost Insights: Breaking Down Infosys Limited and VMware, Inc.'s Expenses
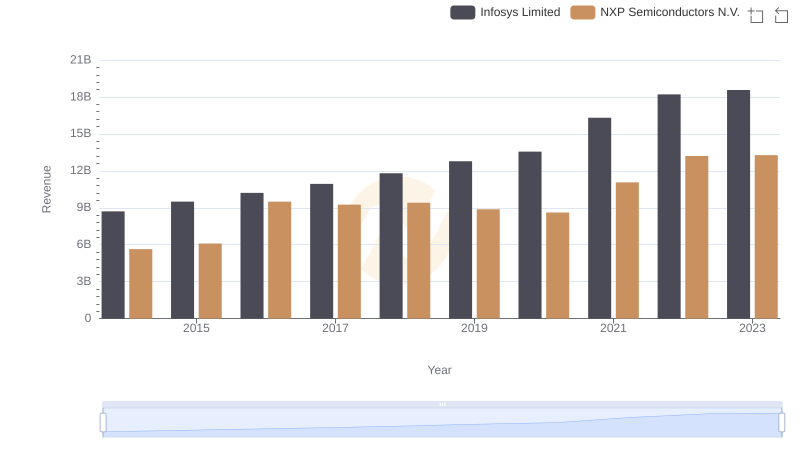
Revenue Insights: Infosys Limited and NXP Semiconductors N.V. Performance Compared
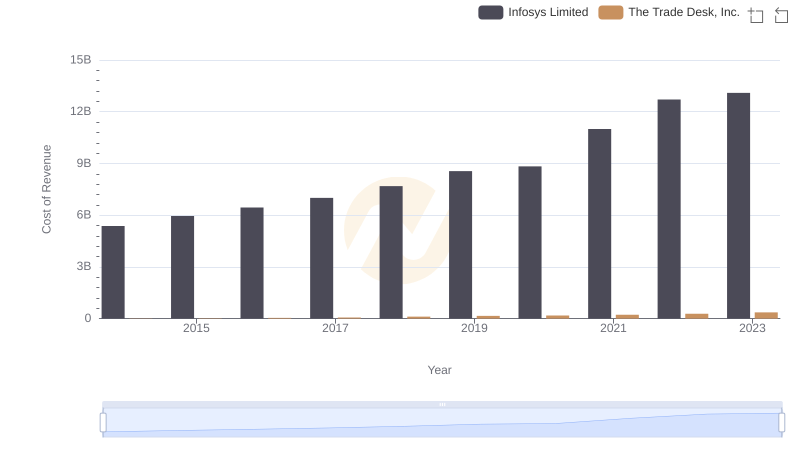
Cost of Revenue: Key Insights for Infosys Limited and The Trade Desk, Inc.
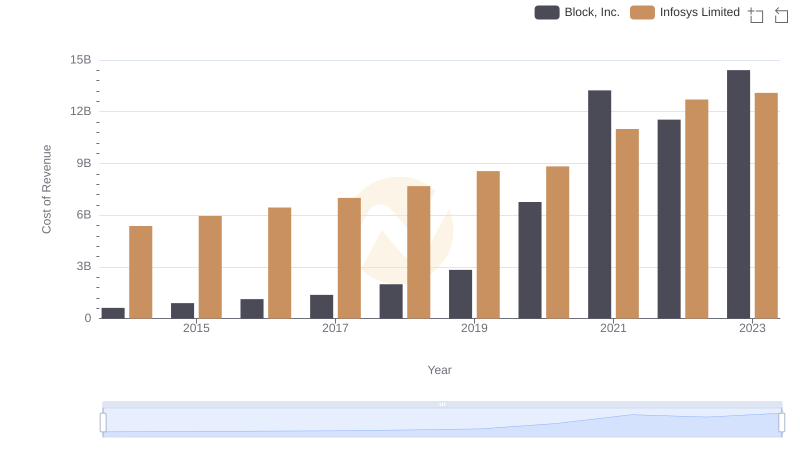
Cost Insights: Breaking Down Infosys Limited and Block, Inc.'s Expenses
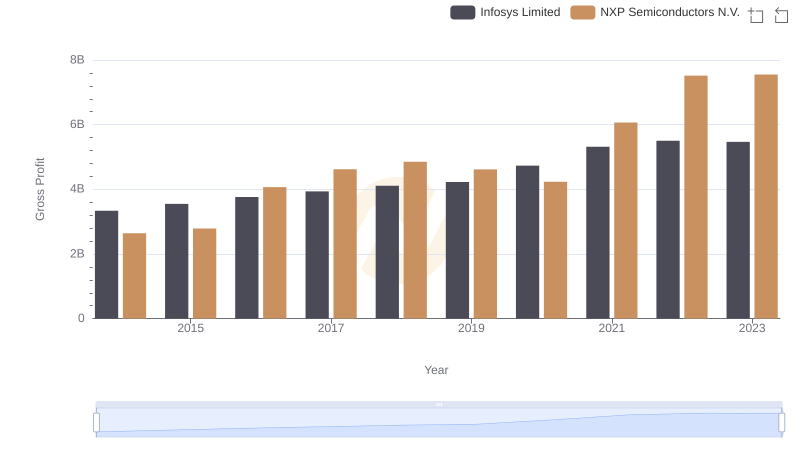
Gross Profit Analysis: Comparing Infosys Limited and NXP Semiconductors N.V.
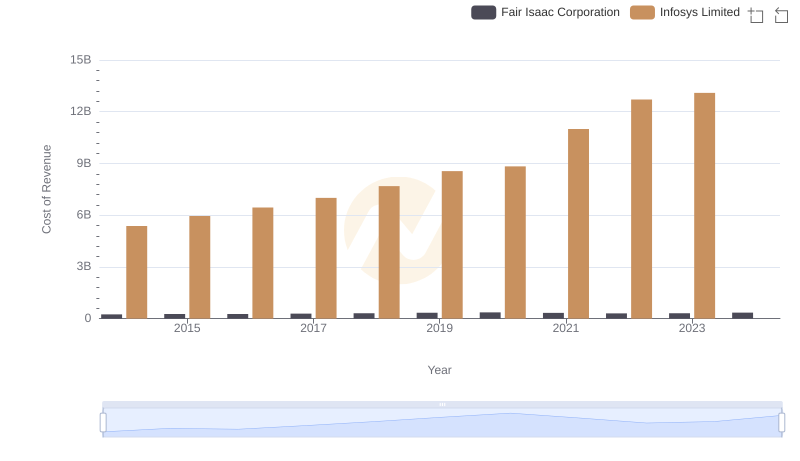
Cost Insights: Breaking Down Infosys Limited and Fair Isaac Corporation's Expenses
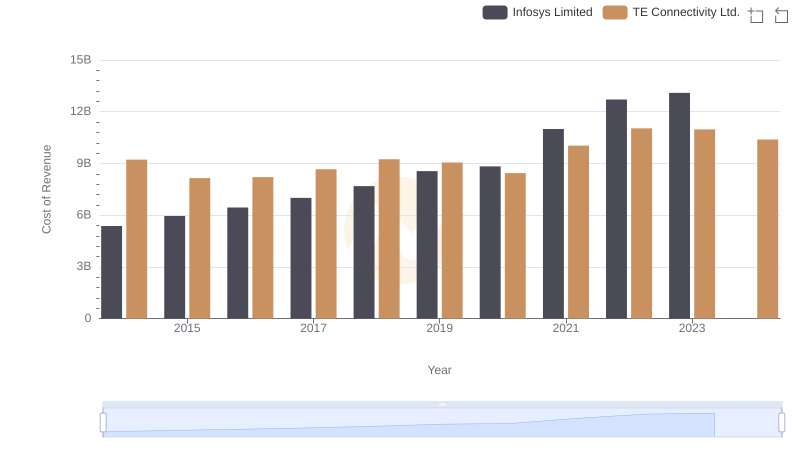
Cost Insights: Breaking Down Infosys Limited and TE Connectivity Ltd.'s Expenses
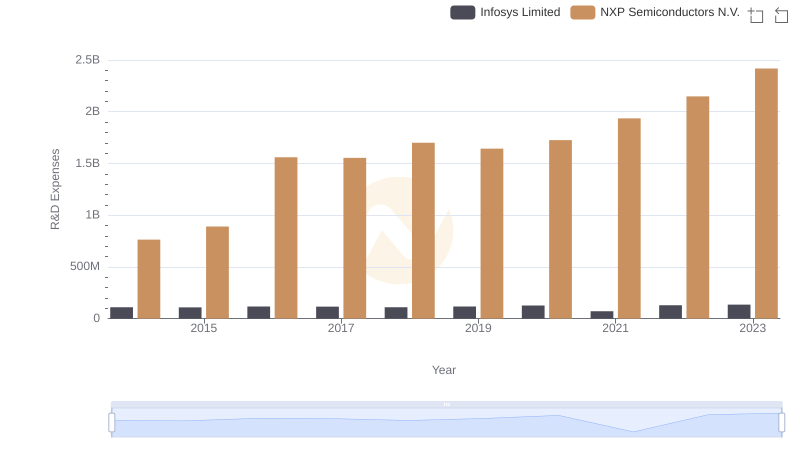
Research and Development Investment: Infosys Limited vs NXP Semiconductors N.V.
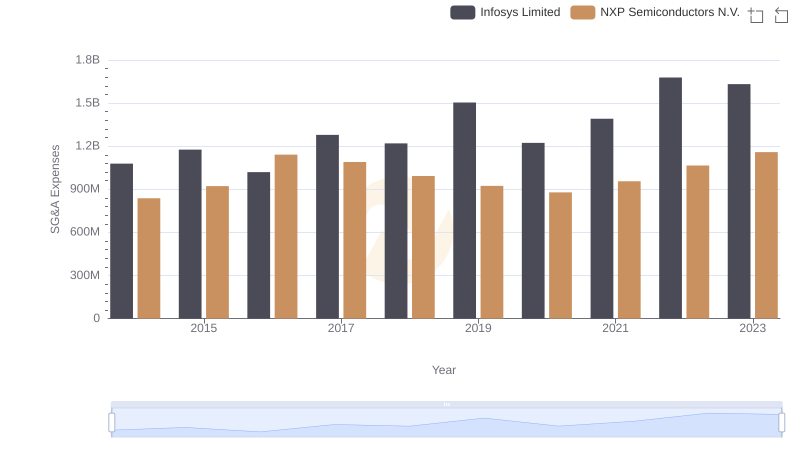
SG&A Efficiency Analysis: Comparing Infosys Limited and NXP Semiconductors N.V.
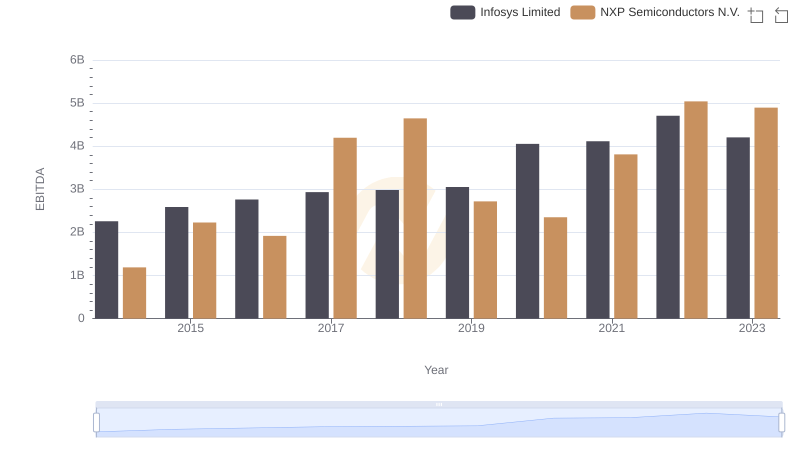
EBITDA Metrics Evaluated: Infosys Limited vs NXP Semiconductors N.V.