| __timestamp | Block, Inc. | Infosys Limited |
|---|---|---|
| Wednesday, January 1, 2014 | 624118000 | 5374000000 |
| Thursday, January 1, 2015 | 897088000 | 5950000000 |
| Friday, January 1, 2016 | 1132683000 | 6446000000 |
| Sunday, January 1, 2017 | 1374947000 | 7001000000 |
| Monday, January 1, 2018 | 1994477000 | 7687000000 |
| Tuesday, January 1, 2019 | 2823815000 | 8552000000 |
| Wednesday, January 1, 2020 | 6764169000 | 8828000000 |
| Friday, January 1, 2021 | 13241380000 | 10996000000 |
| Saturday, January 1, 2022 | 11539695000 | 12709000000 |
| Sunday, January 1, 2023 | 14410737000 | 13096000000 |
Data in motion
In the ever-evolving landscape of global business, understanding cost structures is pivotal. This analysis delves into the cost of revenue trends for two industry giants: Infosys Limited and Block, Inc., from 2014 to 2023. Over this period, Block, Inc. has seen a staggering increase in its cost of revenue, growing by over 2,200%, reflecting its rapid expansion and scaling efforts. In contrast, Infosys Limited, a stalwart in the IT services sector, experienced a more modest growth of approximately 144% in its cost of revenue, indicative of its stable and mature business model.
This comparative analysis underscores the diverse strategies and growth trajectories of these two companies, offering valuable insights for investors and industry analysts alike.
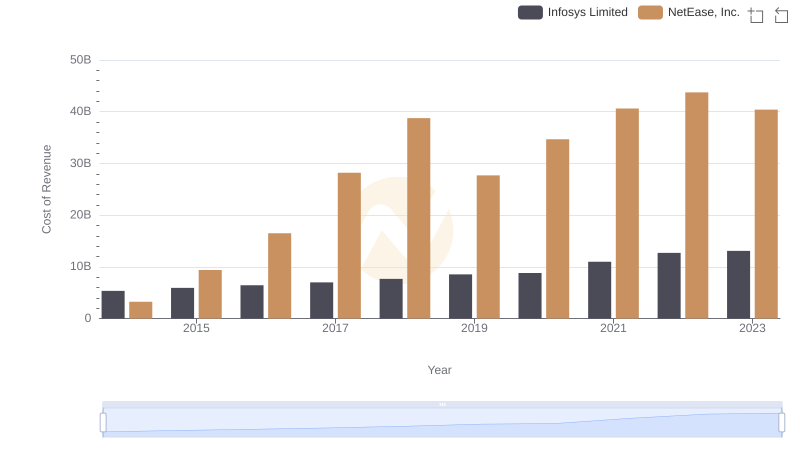
Cost of Revenue Trends: Infosys Limited vs NetEase, Inc.
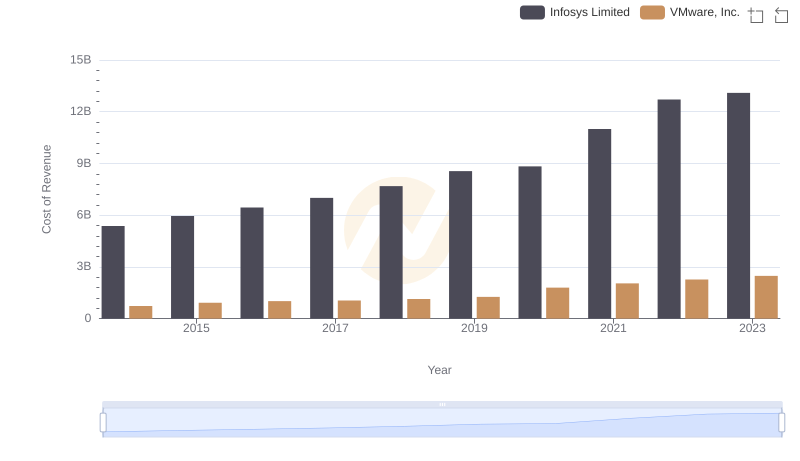
Cost Insights: Breaking Down Infosys Limited and VMware, Inc.'s Expenses
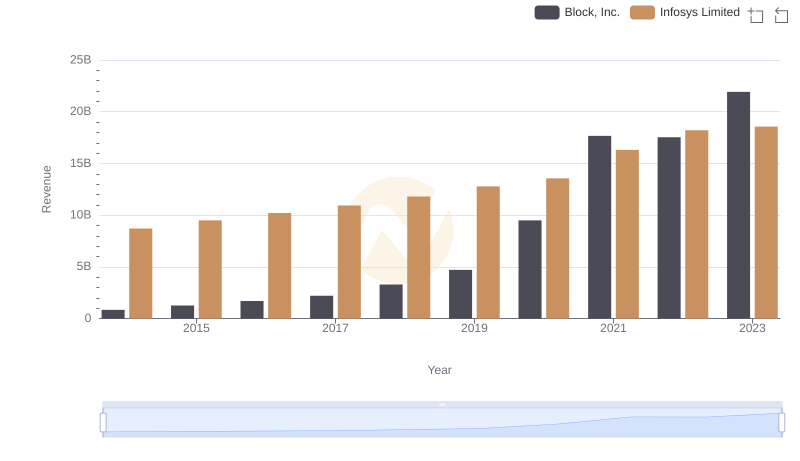
Who Generates More Revenue? Infosys Limited or Block, Inc.
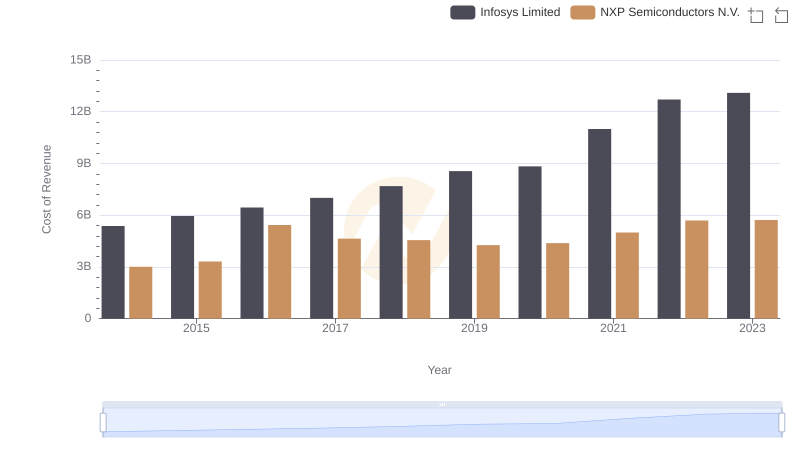
Analyzing Cost of Revenue: Infosys Limited and NXP Semiconductors N.V.
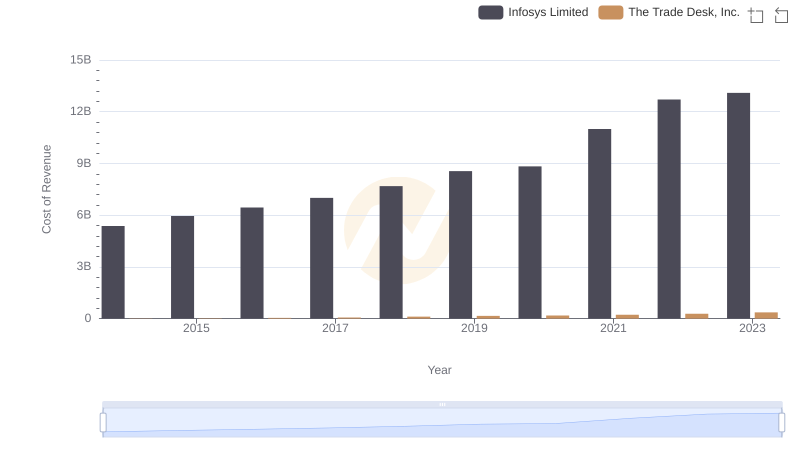
Cost of Revenue: Key Insights for Infosys Limited and The Trade Desk, Inc.
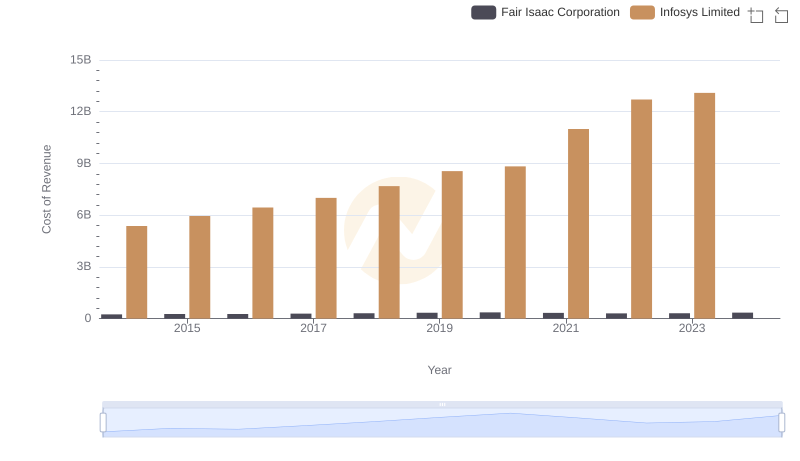
Cost Insights: Breaking Down Infosys Limited and Fair Isaac Corporation's Expenses
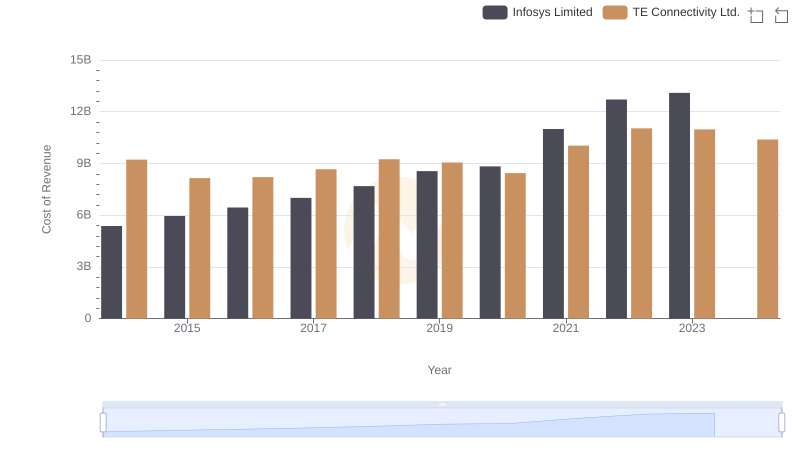
Cost Insights: Breaking Down Infosys Limited and TE Connectivity Ltd.'s Expenses
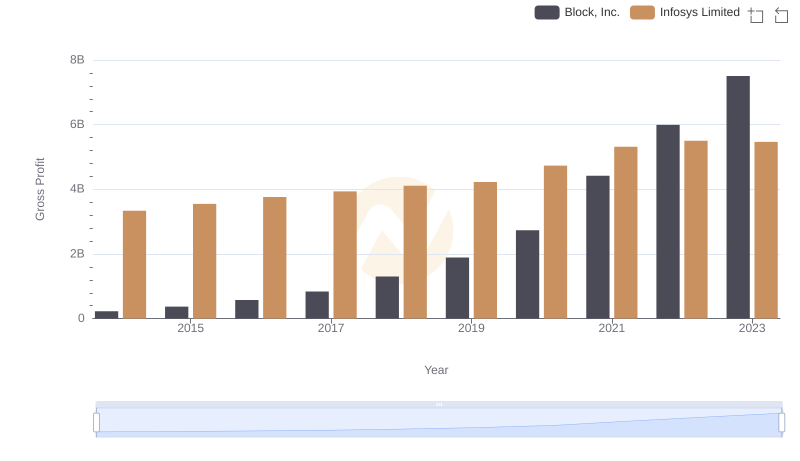
Gross Profit Comparison: Infosys Limited and Block, Inc. Trends
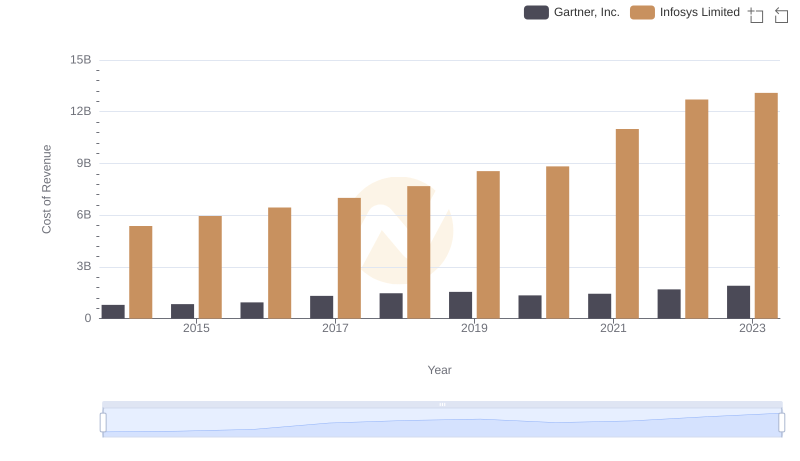
Cost of Revenue Comparison: Infosys Limited vs Gartner, Inc.
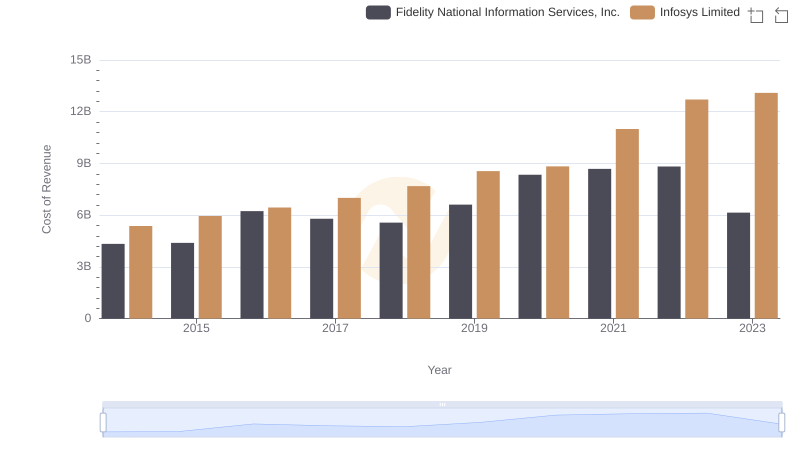
Infosys Limited vs Fidelity National Information Services, Inc.: Efficiency in Cost of Revenue Explored
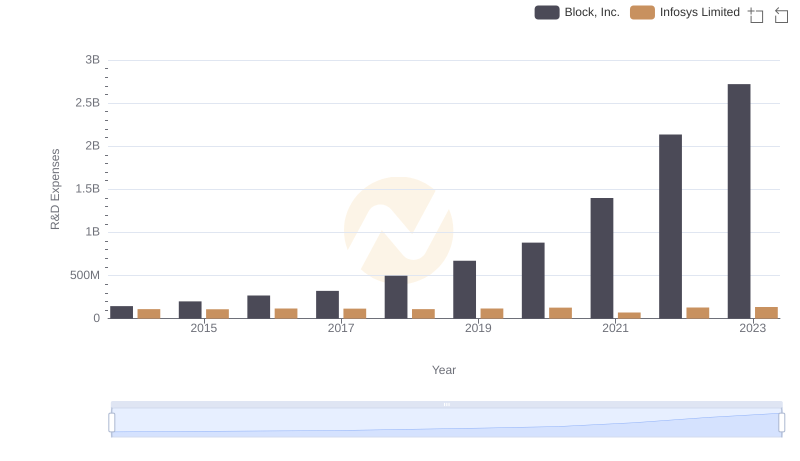
R&D Insights: How Infosys Limited and Block, Inc. Allocate Funds
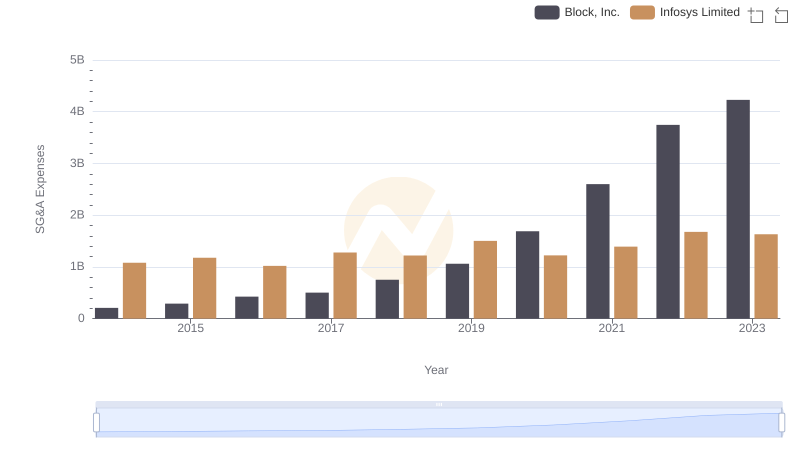
Infosys Limited vs Block, Inc.: SG&A Expense Trends