| __timestamp | Atlassian Corporation | Infosys Limited |
|---|---|---|
| Wednesday, January 1, 2014 | 37986000 | 5374000000 |
| Thursday, January 1, 2015 | 52932000 | 5950000000 |
| Friday, January 1, 2016 | 75783000 | 6446000000 |
| Sunday, January 1, 2017 | 119161000 | 7001000000 |
| Monday, January 1, 2018 | 172690000 | 7687000000 |
| Tuesday, January 1, 2019 | 210285000 | 8552000000 |
| Wednesday, January 1, 2020 | 268807000 | 8828000000 |
| Friday, January 1, 2021 | 336021000 | 10996000000 |
| Saturday, January 1, 2022 | 465707000 | 12709000000 |
| Sunday, January 1, 2023 | 633765000 | 13096000000 |
| Monday, January 1, 2024 | 803495000 |
Igniting the spark of knowledge
In the ever-evolving landscape of global technology, understanding the cost of revenue is crucial for assessing a company's financial health. This analysis delves into the cost of revenue trends for two tech giants: Infosys Limited and Atlassian Corporation, from 2014 to 2023.
Infosys Limited: Over the past decade, Infosys has seen a steady increase in its cost of revenue, peaking at approximately $13 billion in 2023. This represents a growth of over 140% from 2014, reflecting its expanding operations and market reach.
Atlassian Corporation: Starting with a modest cost of revenue in 2014, Atlassian has experienced a dramatic rise, reaching around $800 million by 2023. This marks an impressive growth of over 2000%, showcasing its rapid expansion in the software industry.
While Infosys shows consistent growth, Atlassian's exponential increase highlights its aggressive market strategy. However, data for 2024 is missing, leaving room for speculation on future trends.
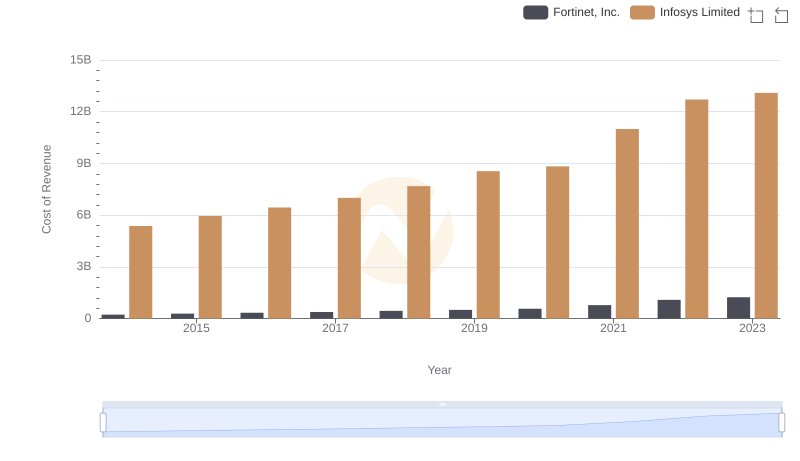
Cost of Revenue Comparison: Infosys Limited vs Fortinet, Inc.
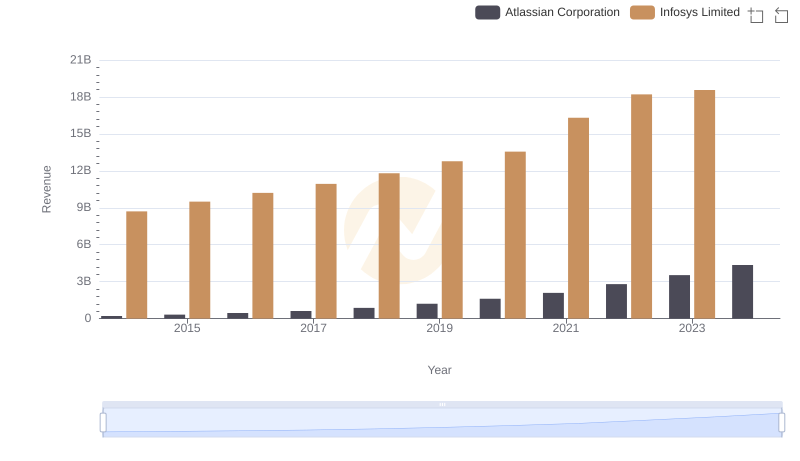
Revenue Showdown: Infosys Limited vs Atlassian Corporation
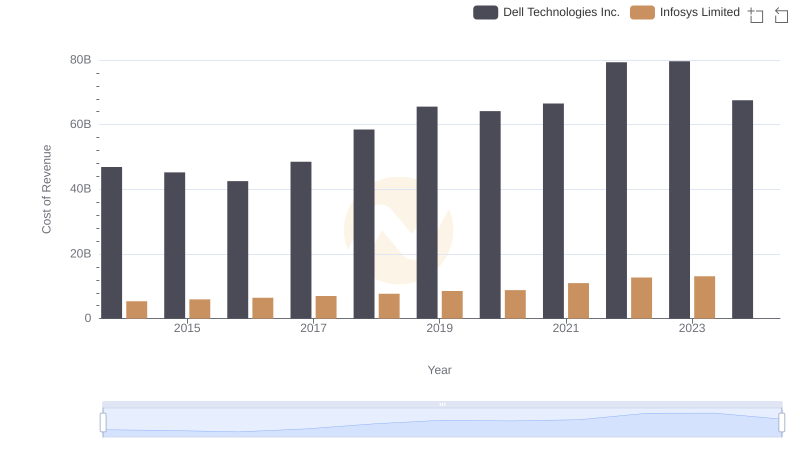
Cost Insights: Breaking Down Infosys Limited and Dell Technologies Inc.'s Expenses
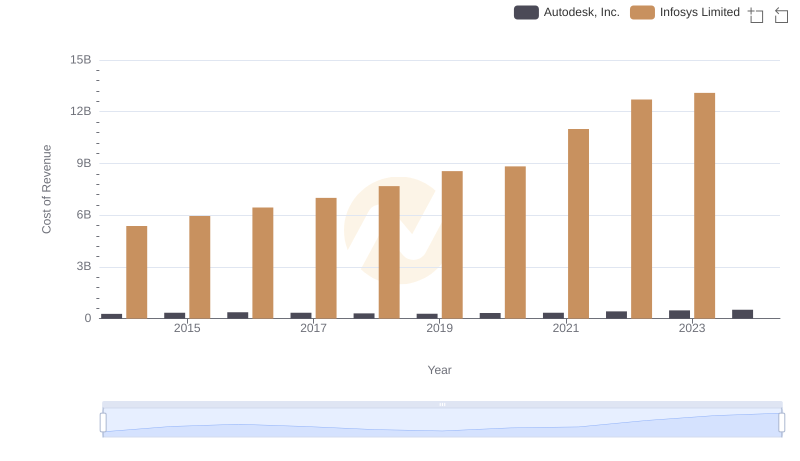
Analyzing Cost of Revenue: Infosys Limited and Autodesk, Inc.
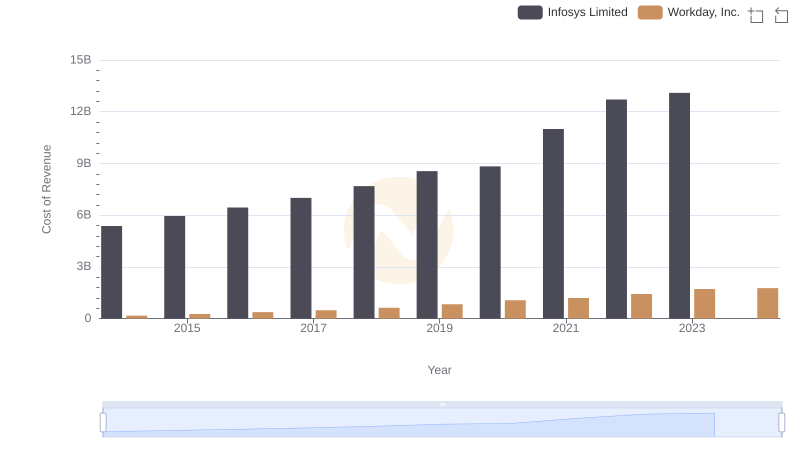
Cost of Revenue Trends: Infosys Limited vs Workday, Inc.
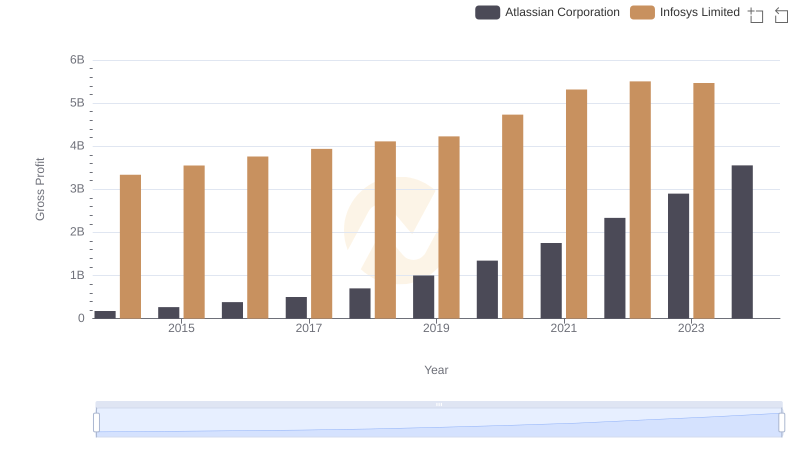
Gross Profit Comparison: Infosys Limited and Atlassian Corporation Trends
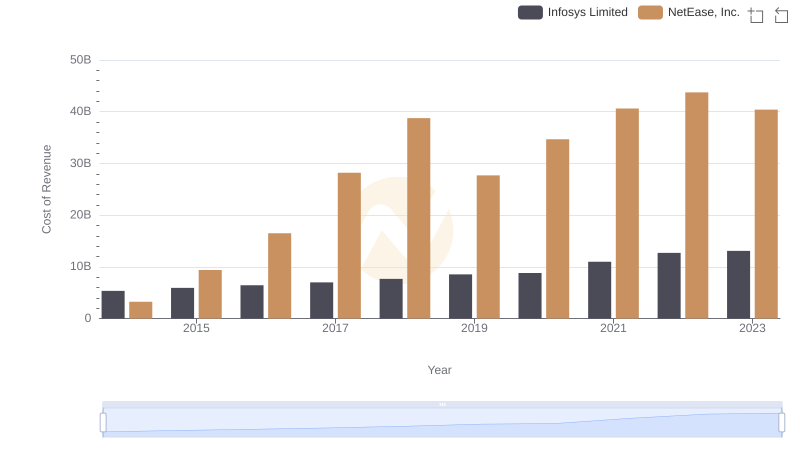
Cost of Revenue Trends: Infosys Limited vs NetEase, Inc.
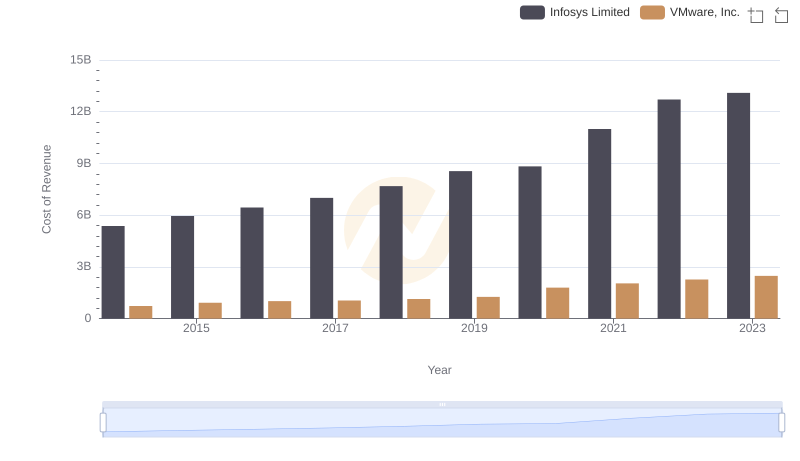
Cost Insights: Breaking Down Infosys Limited and VMware, Inc.'s Expenses
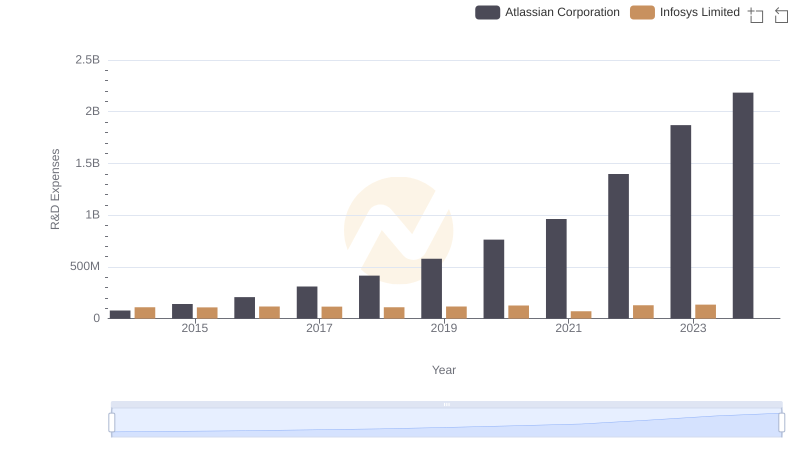
R&D Spending Showdown: Infosys Limited vs Atlassian Corporation
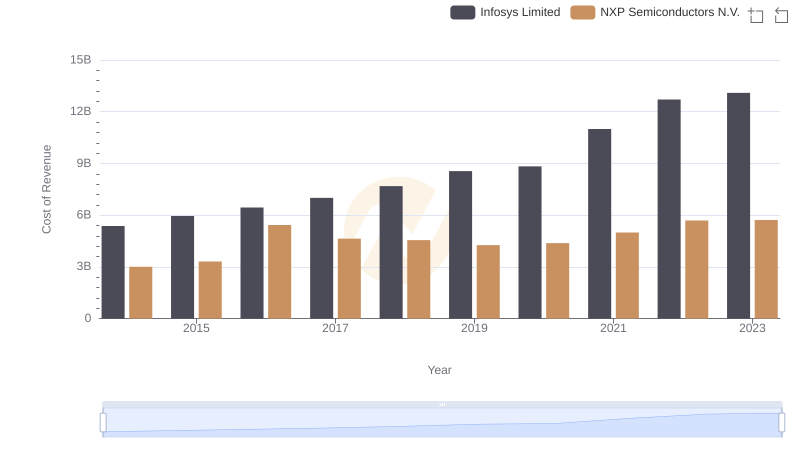
Analyzing Cost of Revenue: Infosys Limited and NXP Semiconductors N.V.
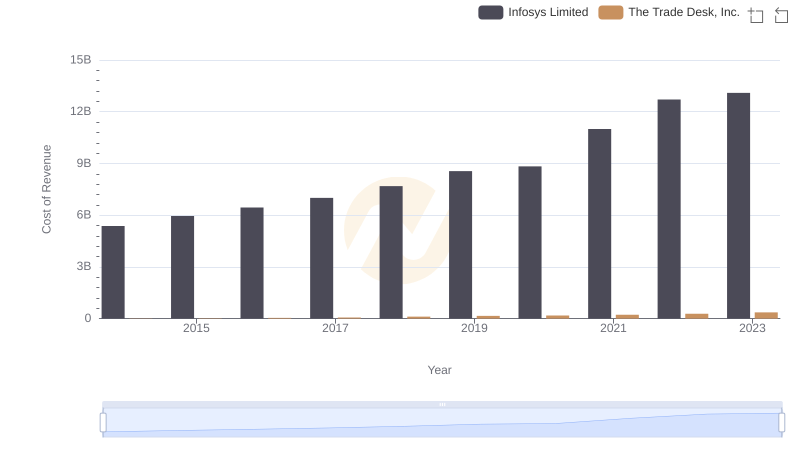
Cost of Revenue: Key Insights for Infosys Limited and The Trade Desk, Inc.
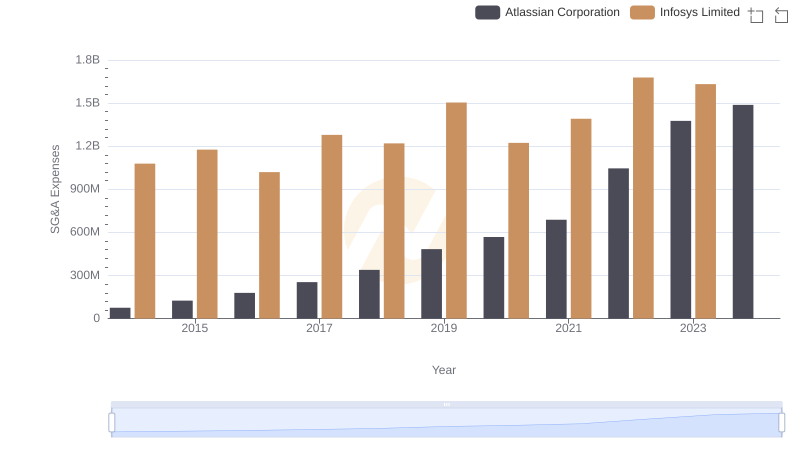
Breaking Down SG&A Expenses: Infosys Limited vs Atlassian Corporation