| __timestamp | Dell Technologies Inc. | Infosys Limited |
|---|---|---|
| Wednesday, January 1, 2014 | 46892000000 | 5374000000 |
| Thursday, January 1, 2015 | 45246000000 | 5950000000 |
| Friday, January 1, 2016 | 42524000000 | 6446000000 |
| Sunday, January 1, 2017 | 48515000000 | 7001000000 |
| Monday, January 1, 2018 | 58503000000 | 7687000000 |
| Tuesday, January 1, 2019 | 65568000000 | 8552000000 |
| Wednesday, January 1, 2020 | 64176000000 | 8828000000 |
| Friday, January 1, 2021 | 66530000000 | 10996000000 |
| Saturday, January 1, 2022 | 79306000000 | 12709000000 |
| Sunday, January 1, 2023 | 79615000000 | 13096000000 |
| Monday, January 1, 2024 | 67556000000 |
Igniting the spark of knowledge
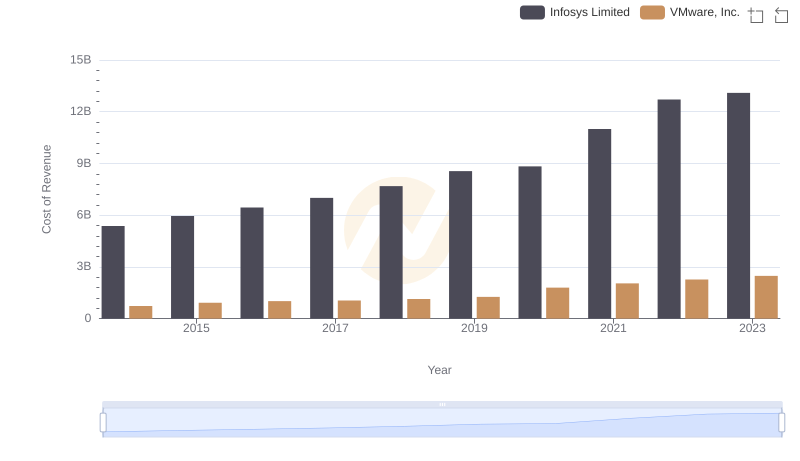
In the ever-evolving landscape of global technology, understanding the cost structures of industry giants like Infosys Limited and Dell Technologies Inc. offers valuable insights. Over the past decade, Dell Technologies has consistently maintained a higher cost of revenue compared to Infosys, reflecting its expansive hardware and services operations. From 2014 to 2023, Dell's cost of revenue surged by approximately 70%, peaking in 2023. In contrast, Infosys, primarily a software and consulting powerhouse, saw a more modest increase of around 144% in the same period, highlighting its efficient cost management strategies.
Interestingly, 2024 data for Infosys is missing, suggesting a potential shift or anomaly in reporting. This comparative analysis not only underscores the diverse operational strategies of these tech titans but also provides a window into their financial health and market positioning. Stay tuned as we delve deeper into these trends and their implications for the future.
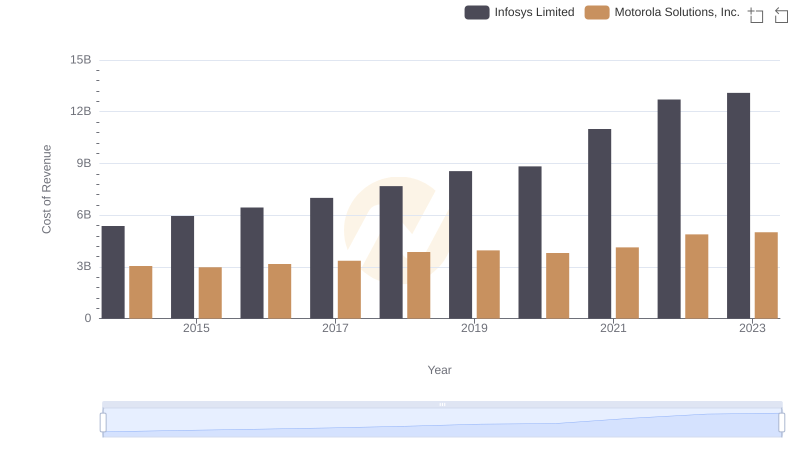
Cost of Revenue Comparison: Infosys Limited vs Motorola Solutions, Inc.
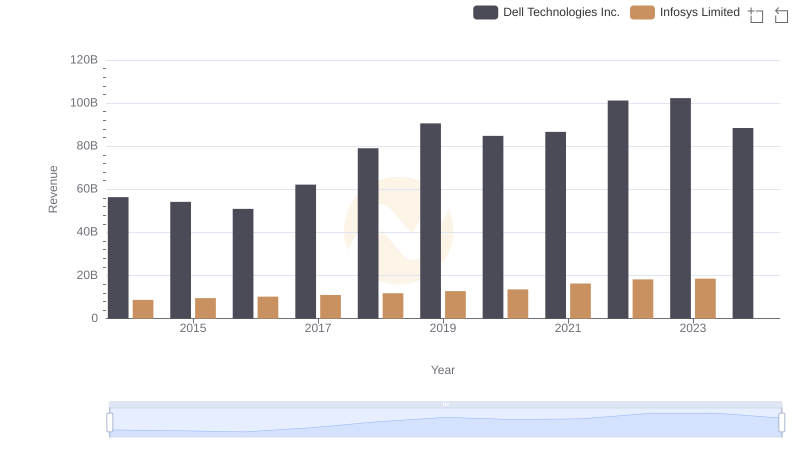
Annual Revenue Comparison: Infosys Limited vs Dell Technologies Inc.
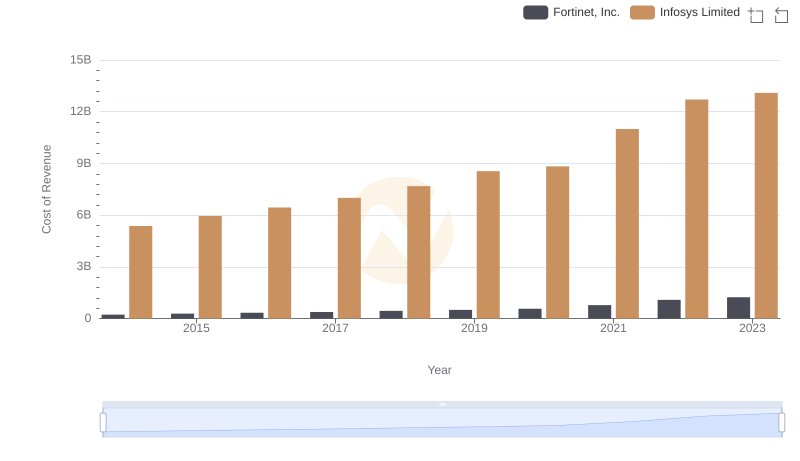
Cost of Revenue Comparison: Infosys Limited vs Fortinet, Inc.
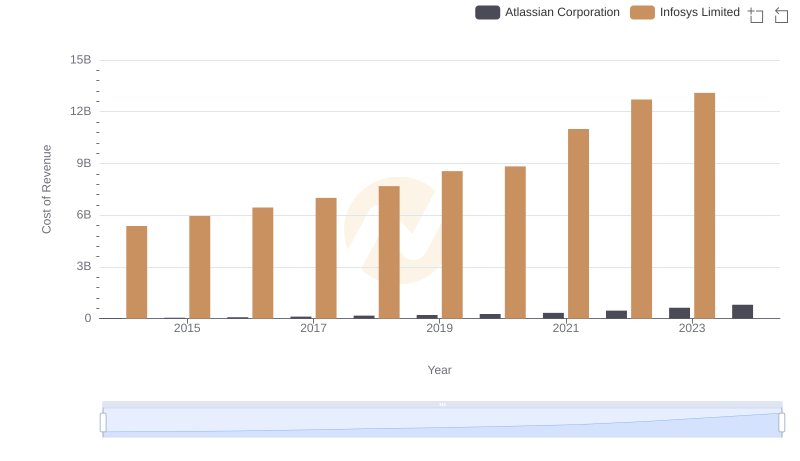
Analyzing Cost of Revenue: Infosys Limited and Atlassian Corporation
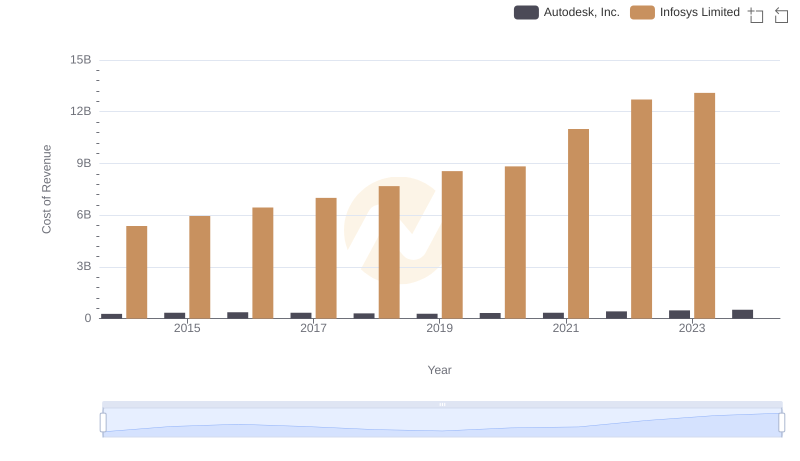
Analyzing Cost of Revenue: Infosys Limited and Autodesk, Inc.
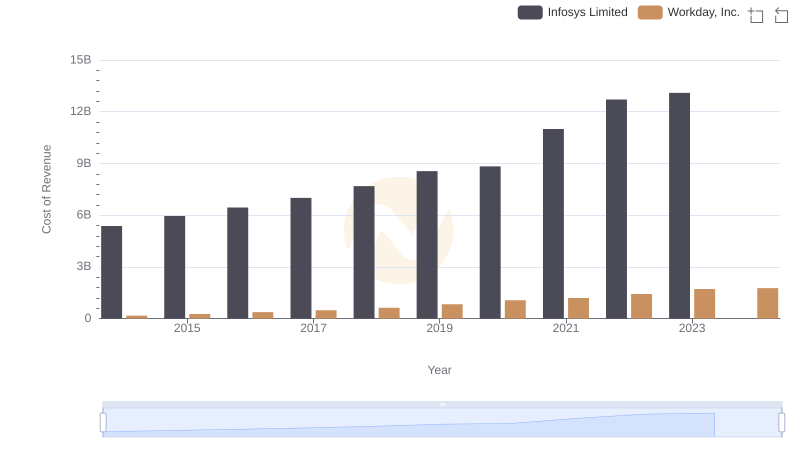
Cost of Revenue Trends: Infosys Limited vs Workday, Inc.
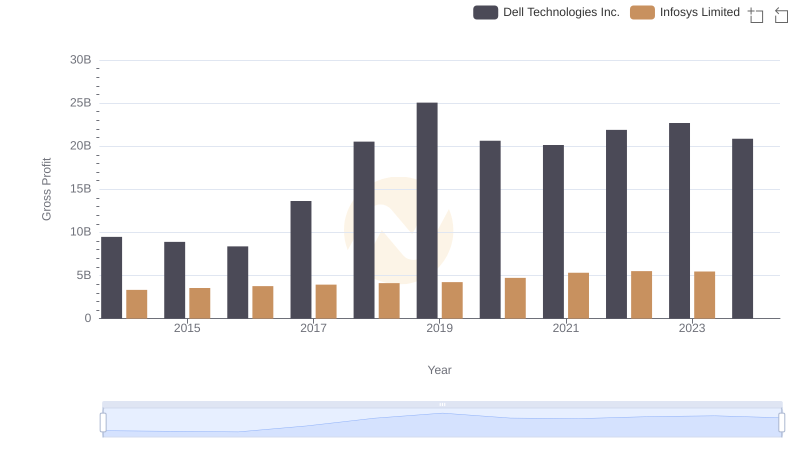
Gross Profit Trends Compared: Infosys Limited vs Dell Technologies Inc.
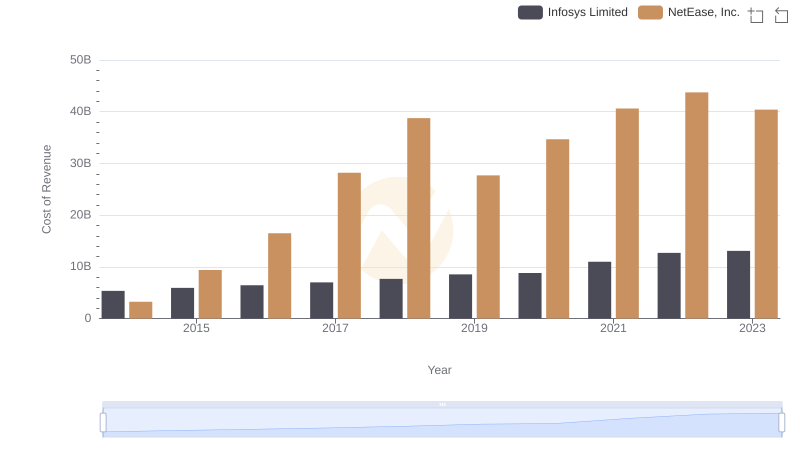
Cost of Revenue Trends: Infosys Limited vs NetEase, Inc.
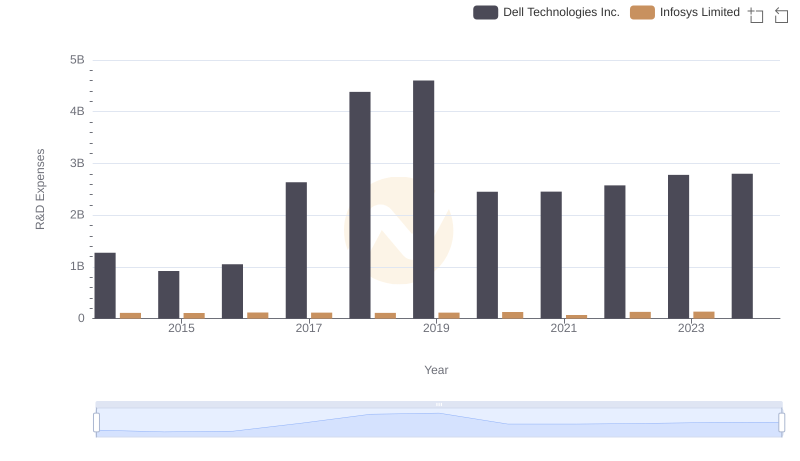
Research and Development Investment: Infosys Limited vs Dell Technologies Inc.
Cost Insights: Breaking Down Infosys Limited and VMware, Inc.'s Expenses
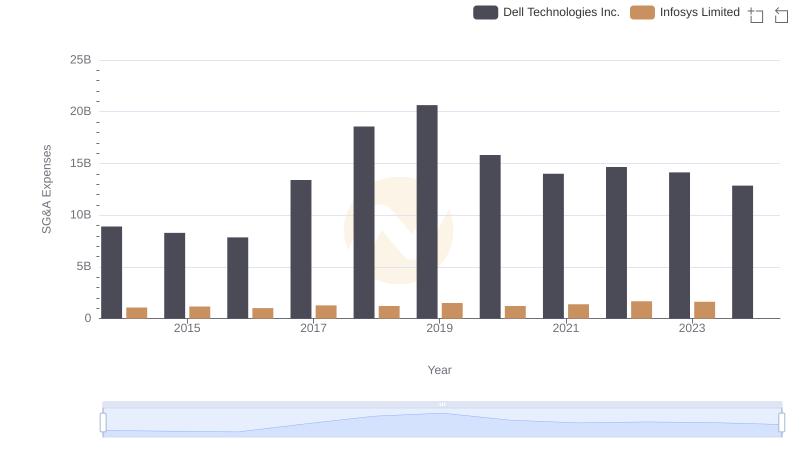
Infosys Limited or Dell Technologies Inc.: Who Manages SG&A Costs Better?
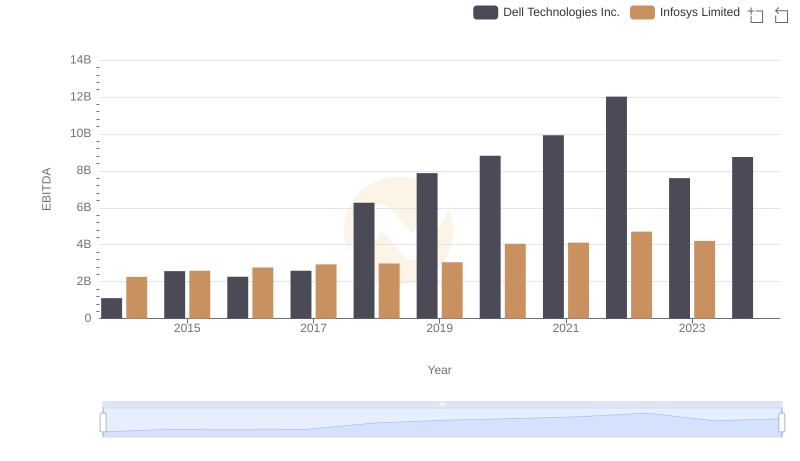
EBITDA Metrics Evaluated: Infosys Limited vs Dell Technologies Inc.