| __timestamp | American Airlines Group Inc. | Global Payments Inc. |
|---|---|---|
| Wednesday, January 1, 2014 | 31939000000 | 1022107000 |
| Thursday, January 1, 2015 | 27967000000 | 1147639000 |
| Friday, January 1, 2016 | 28339000000 | 1603532000 |
| Sunday, January 1, 2017 | 31154000000 | 1928037000 |
| Monday, January 1, 2018 | 34490000000 | 1095014000 |
| Tuesday, January 1, 2019 | 35379000000 | 2073803000 |
| Wednesday, January 1, 2020 | 24933000000 | 3650727000 |
| Friday, January 1, 2021 | 29855000000 | 3773725000 |
| Saturday, January 1, 2022 | 39934000000 | 3778617000 |
| Sunday, January 1, 2023 | 40978000000 | 3727521000 |
| Monday, January 1, 2024 | 3760116000 |
Unleashing insights
In the ever-evolving landscape of American business, the cost of revenue serves as a critical indicator of operational efficiency. This chart juxtaposes the financial trajectories of Global Payments Inc., a leader in payment technology, and American Airlines Group Inc., a titan of the aviation industry, from 2014 to 2023.
American Airlines Group Inc. has seen its cost of revenue fluctuate, peaking in 2023 with a 28% increase from its 2014 figures. This reflects the airline's ongoing battle with fluctuating fuel prices and operational costs. In contrast, Global Payments Inc. has experienced a steady rise, with its cost of revenue nearly quadrupling over the same period, highlighting the growing demand for digital payment solutions.
While American Airlines grapples with external economic pressures, Global Payments benefits from the digital transformation wave, underscoring the contrasting challenges and opportunities faced by these industries.
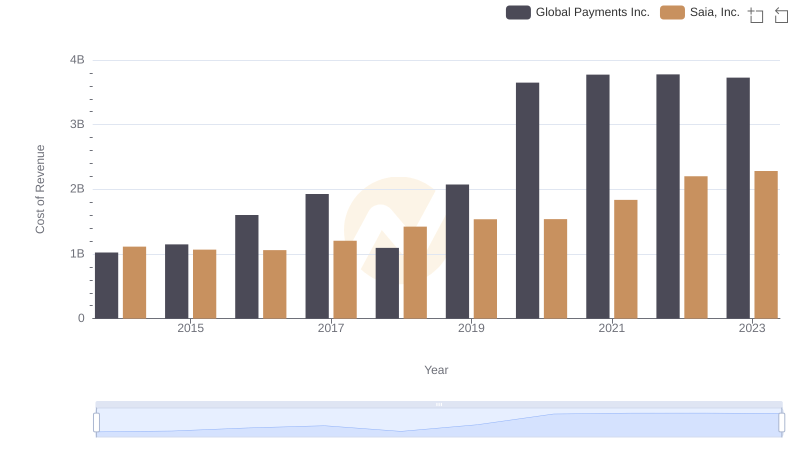
Global Payments Inc. vs Saia, Inc.: Efficiency in Cost of Revenue Explored
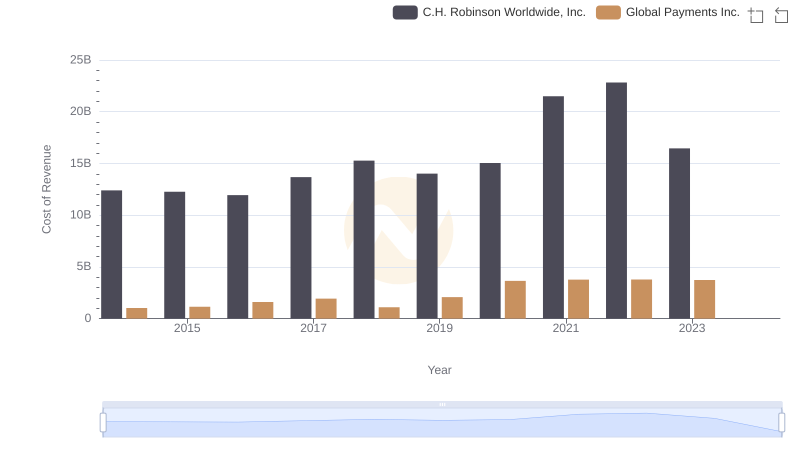
Cost of Revenue Trends: Global Payments Inc. vs C.H. Robinson Worldwide, Inc.
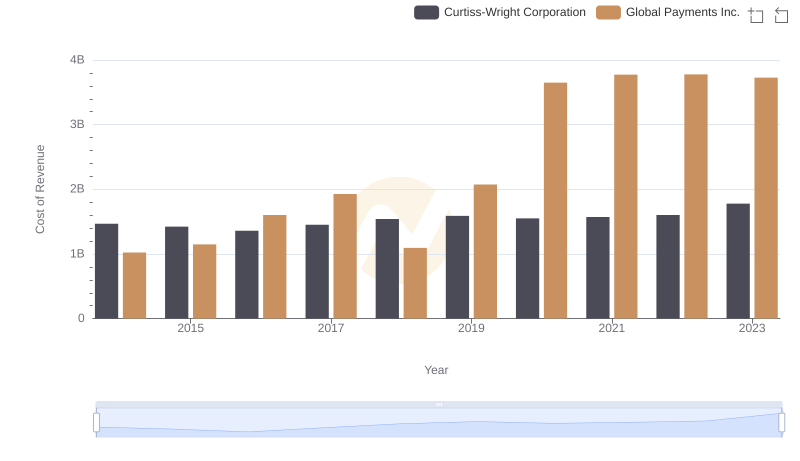
Analyzing Cost of Revenue: Global Payments Inc. and Curtiss-Wright Corporation
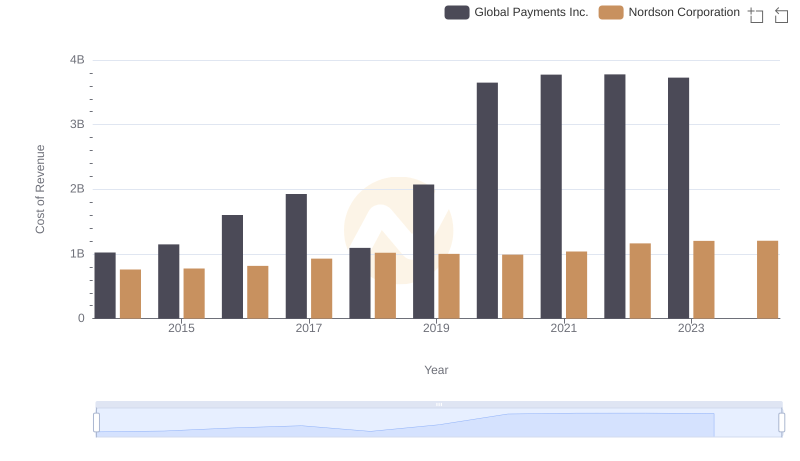
Cost of Revenue Trends: Global Payments Inc. vs Nordson Corporation
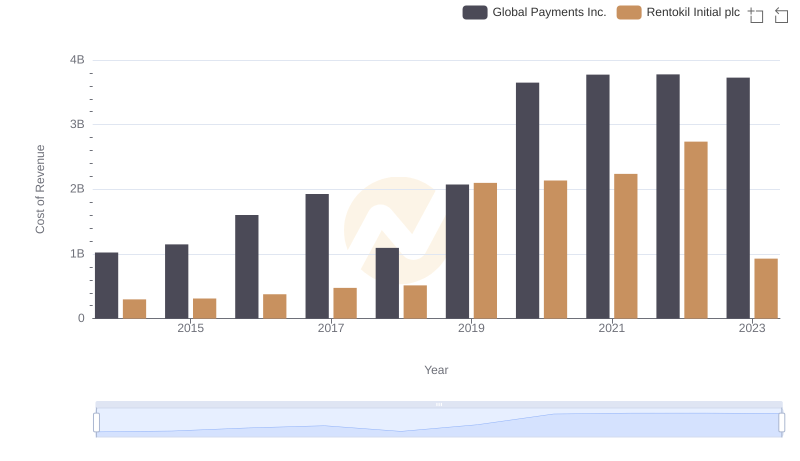
Analyzing Cost of Revenue: Global Payments Inc. and Rentokil Initial plc
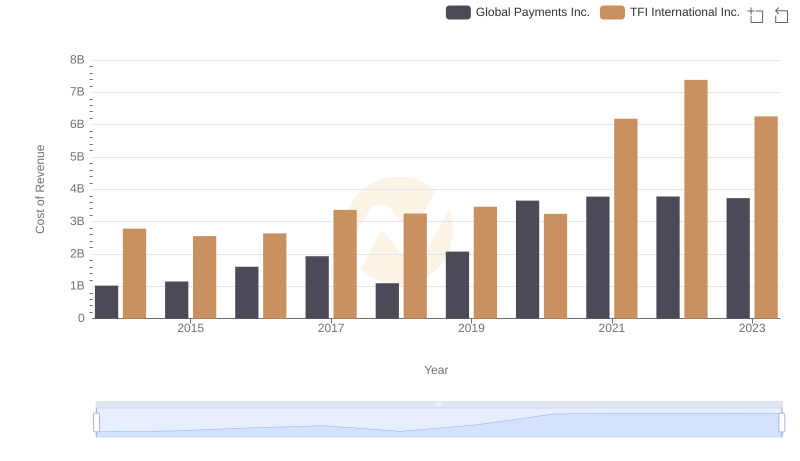
Global Payments Inc. vs TFI International Inc.: Efficiency in Cost of Revenue Explored
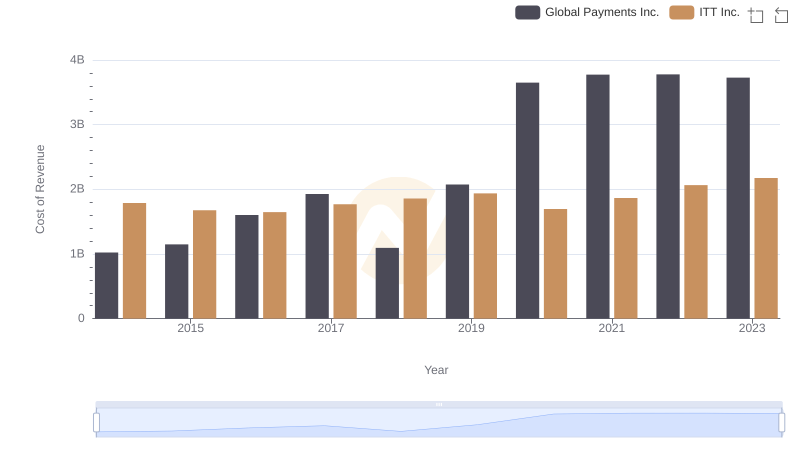
Cost of Revenue: Key Insights for Global Payments Inc. and ITT Inc.
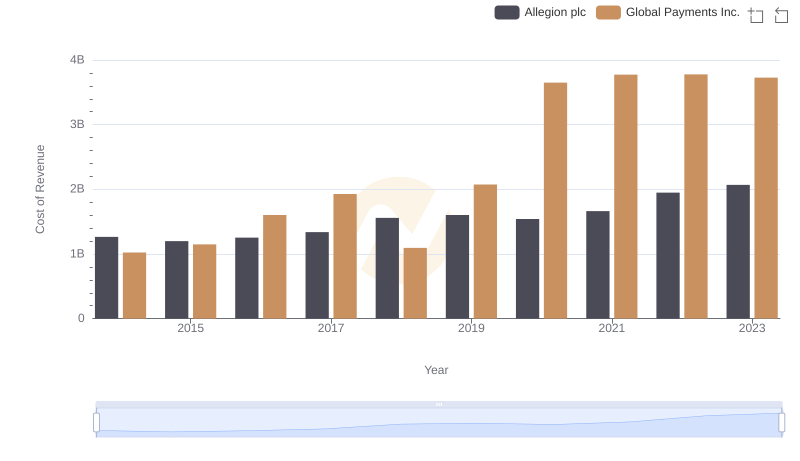
Cost of Revenue Trends: Global Payments Inc. vs Allegion plc