| __timestamp | Global Payments Inc. | Saia, Inc. |
|---|---|---|
| Wednesday, January 1, 2014 | 1022107000 | 1113053000 |
| Thursday, January 1, 2015 | 1147639000 | 1067191000 |
| Friday, January 1, 2016 | 1603532000 | 1058979000 |
| Sunday, January 1, 2017 | 1928037000 | 1203464000 |
| Monday, January 1, 2018 | 1095014000 | 1423779000 |
| Tuesday, January 1, 2019 | 2073803000 | 1537082000 |
| Wednesday, January 1, 2020 | 3650727000 | 1538518000 |
| Friday, January 1, 2021 | 3773725000 | 1837017000 |
| Saturday, January 1, 2022 | 3778617000 | 2201094000 |
| Sunday, January 1, 2023 | 3727521000 | 2282501000 |
| Monday, January 1, 2024 | 3760116000 |
Unveiling the hidden dimensions of data
In the ever-evolving landscape of financial efficiency, Global Payments Inc. and Saia, Inc. have demonstrated intriguing trends in their cost of revenue from 2014 to 2023. Over this period, Global Payments Inc. has seen a remarkable increase of approximately 265% in its cost of revenue, peaking in 2022. Meanwhile, Saia, Inc. has experienced a steady rise, with a 105% increase, reaching its highest in 2023.
This data highlights the contrasting strategies of these two companies. Global Payments Inc. has shown a more aggressive growth pattern, while Saia, Inc. has maintained a consistent upward trajectory. These trends offer valuable insights into how each company navigates its operational costs, reflecting broader industry shifts and economic conditions. As businesses strive for efficiency, understanding these dynamics is crucial for investors and stakeholders alike.
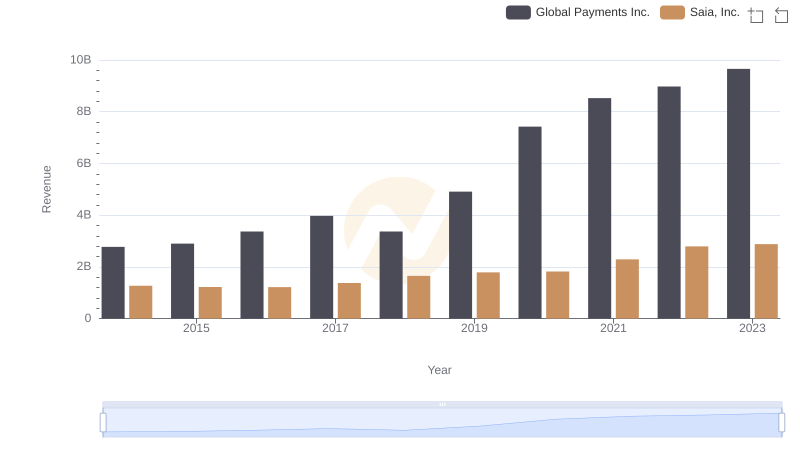
Global Payments Inc. and Saia, Inc.: A Comprehensive Revenue Analysis
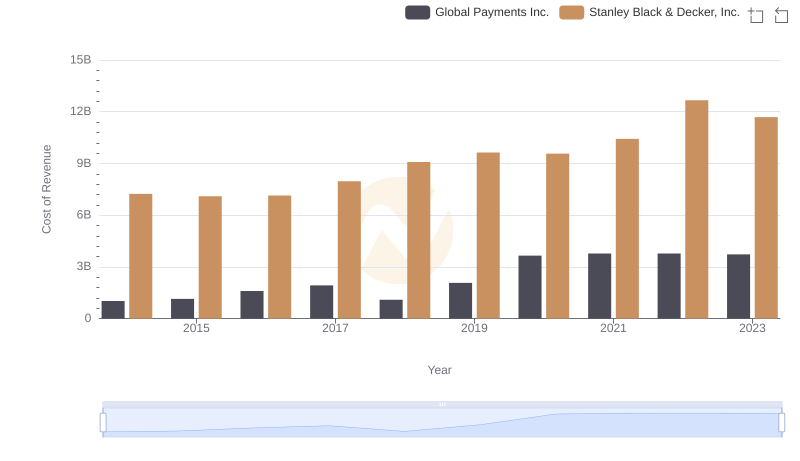
Cost of Revenue Trends: Global Payments Inc. vs Stanley Black & Decker, Inc.
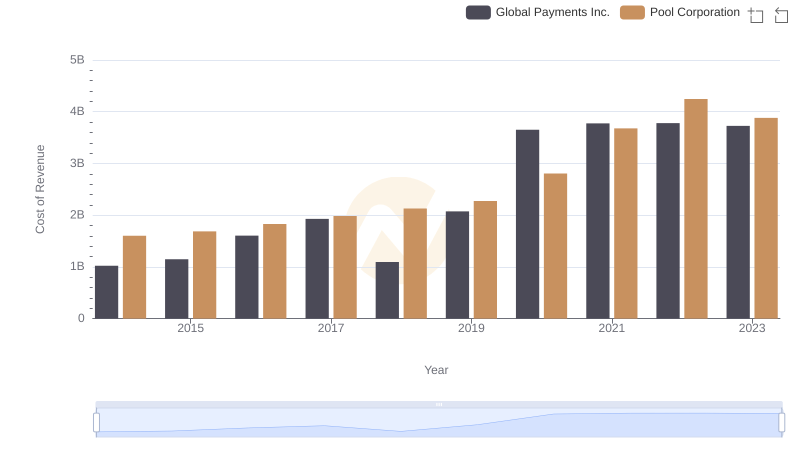
Global Payments Inc. vs Pool Corporation: Efficiency in Cost of Revenue Explored

Analyzing Cost of Revenue: Global Payments Inc. and U-Haul Holding Company
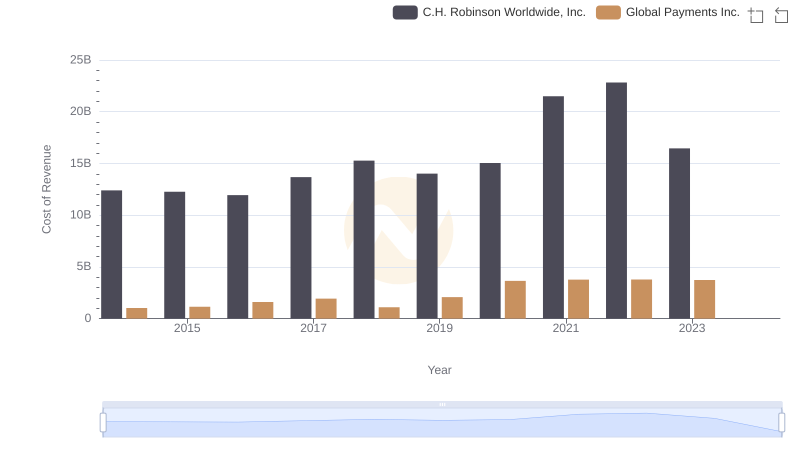
Cost of Revenue Trends: Global Payments Inc. vs C.H. Robinson Worldwide, Inc.
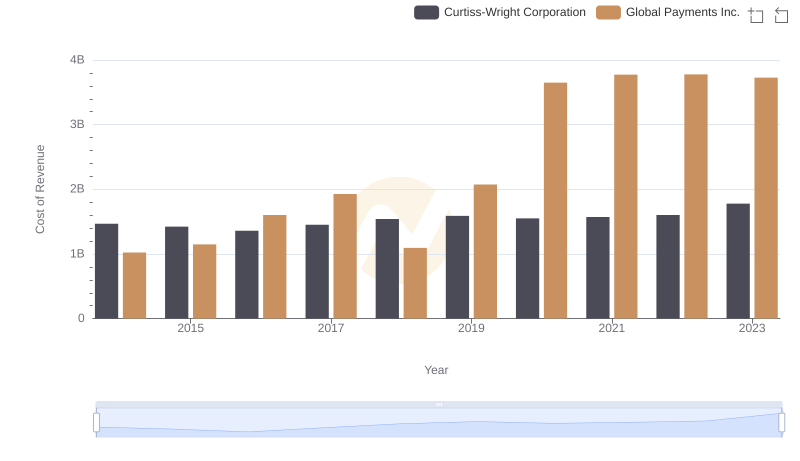
Analyzing Cost of Revenue: Global Payments Inc. and Curtiss-Wright Corporation
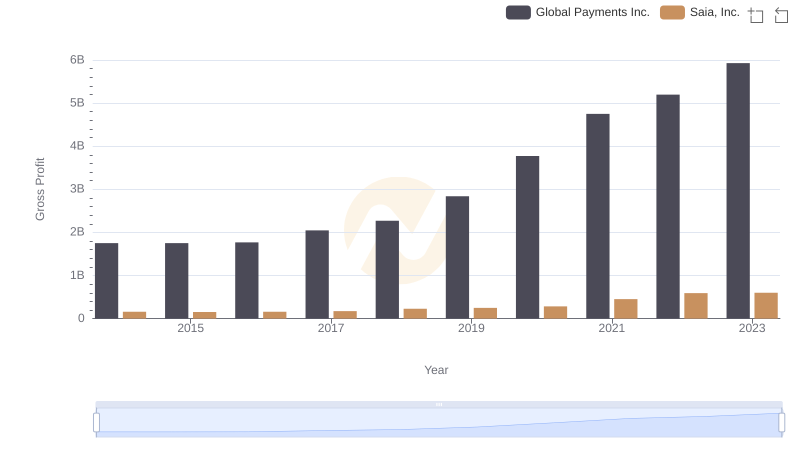
Who Generates Higher Gross Profit? Global Payments Inc. or Saia, Inc.
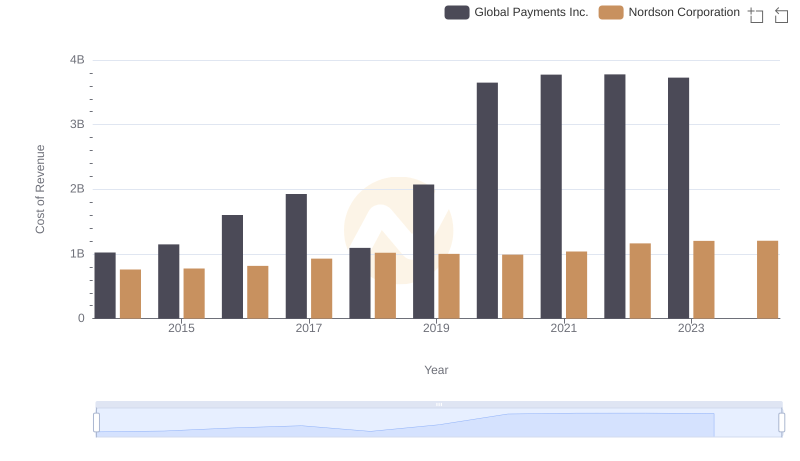
Cost of Revenue Trends: Global Payments Inc. vs Nordson Corporation