| __timestamp | Global Payments Inc. | ITT Inc. |
|---|---|---|
| Wednesday, January 1, 2014 | 1022107000 | 1788200000 |
| Thursday, January 1, 2015 | 1147639000 | 1676500000 |
| Friday, January 1, 2016 | 1603532000 | 1647200000 |
| Sunday, January 1, 2017 | 1928037000 | 1768100000 |
| Monday, January 1, 2018 | 1095014000 | 1857900000 |
| Tuesday, January 1, 2019 | 2073803000 | 1936300000 |
| Wednesday, January 1, 2020 | 3650727000 | 1695600000 |
| Friday, January 1, 2021 | 3773725000 | 1865500000 |
| Saturday, January 1, 2022 | 3778617000 | 2065400000 |
| Sunday, January 1, 2023 | 3727521000 | 2175700000 |
| Monday, January 1, 2024 | 3760116000 | 2383400000 |
In pursuit of knowledge
In the ever-evolving landscape of financial services and industrial manufacturing, understanding cost structures is crucial. Global Payments Inc., a leader in payment technology, and ITT Inc., a key player in engineering solutions, have shown distinct trends in their cost of revenue over the past decade.
From 2014 to 2023, Global Payments Inc. experienced a significant increase in its cost of revenue, peaking in 2022 with a 270% rise from its 2014 figures. This surge reflects the company's aggressive expansion and investment in technology. In contrast, ITT Inc.'s cost of revenue remained relatively stable, with a modest 22% increase over the same period, indicating a consistent operational strategy.
These insights highlight the contrasting business models and market strategies of these two giants, offering a window into their financial health and strategic priorities.
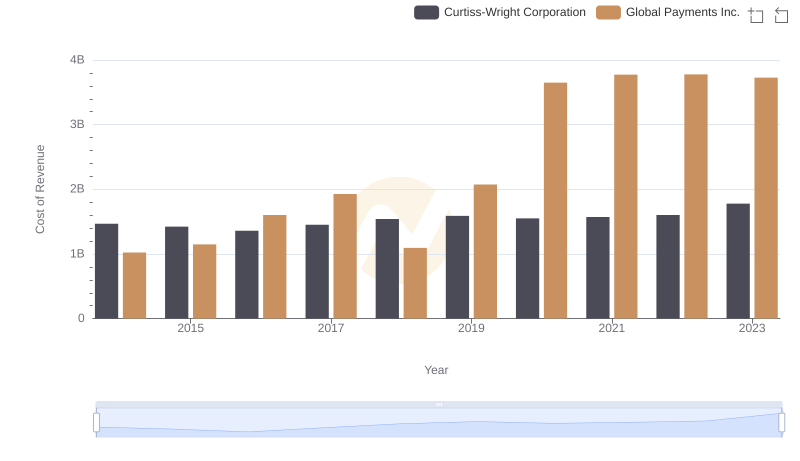
Analyzing Cost of Revenue: Global Payments Inc. and Curtiss-Wright Corporation
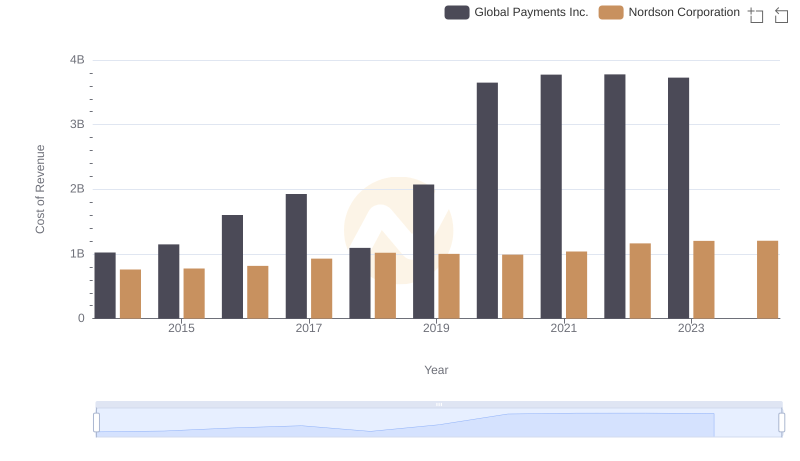
Cost of Revenue Trends: Global Payments Inc. vs Nordson Corporation
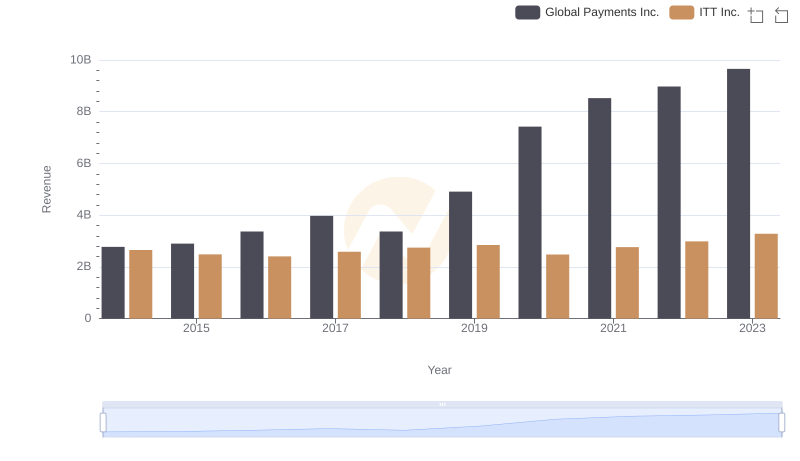
Global Payments Inc. vs ITT Inc.: Examining Key Revenue Metrics
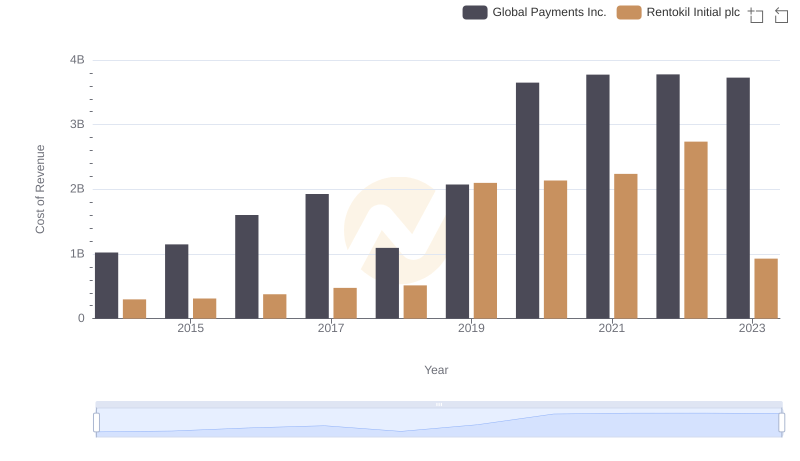
Analyzing Cost of Revenue: Global Payments Inc. and Rentokil Initial plc
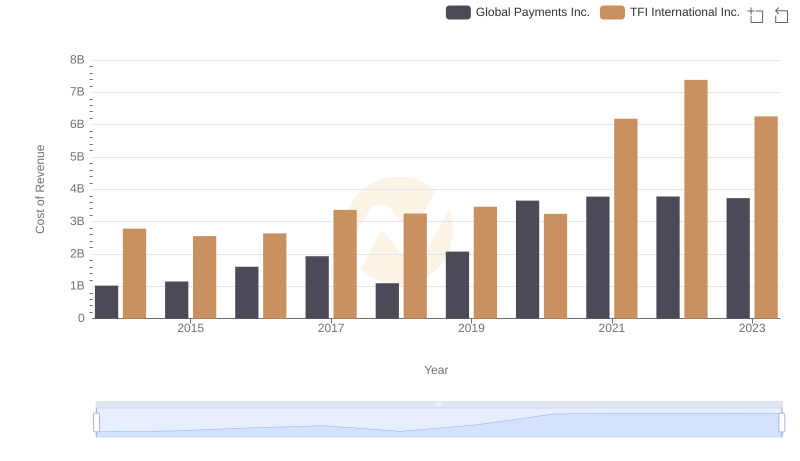
Global Payments Inc. vs TFI International Inc.: Efficiency in Cost of Revenue Explored
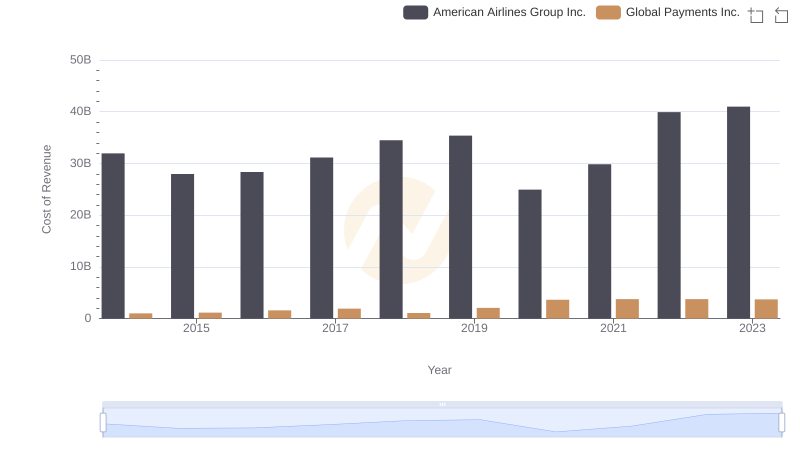
Cost of Revenue Trends: Global Payments Inc. vs American Airlines Group Inc.
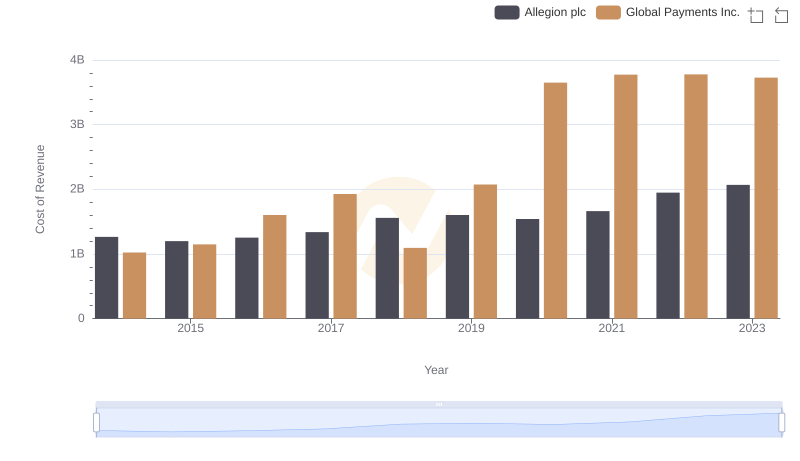
Cost of Revenue Trends: Global Payments Inc. vs Allegion plc
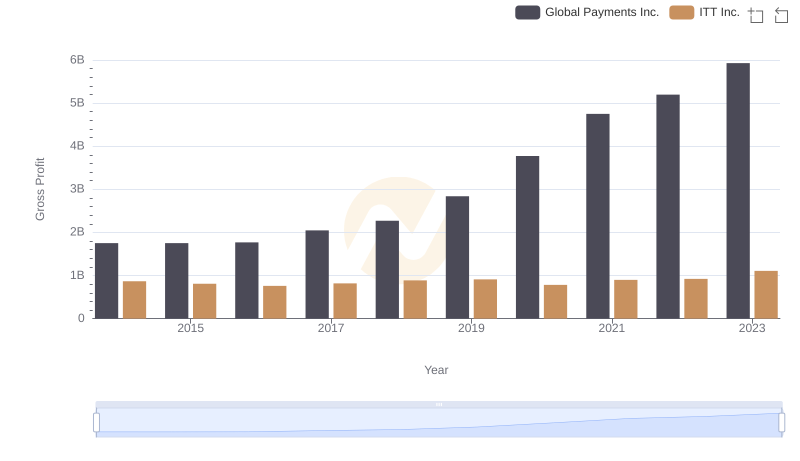
Who Generates Higher Gross Profit? Global Payments Inc. or ITT Inc.
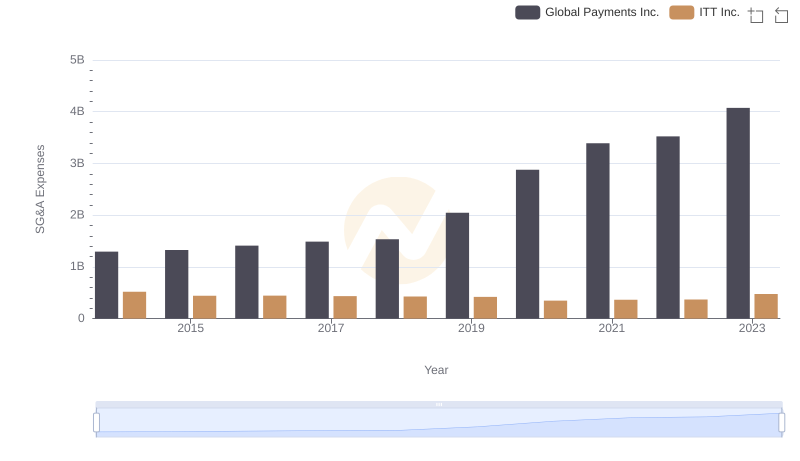
Global Payments Inc. or ITT Inc.: Who Manages SG&A Costs Better?