| __timestamp | C.H. Robinson Worldwide, Inc. | Global Payments Inc. |
|---|---|---|
| Wednesday, January 1, 2014 | 12401436000 | 1022107000 |
| Thursday, January 1, 2015 | 12259014000 | 1147639000 |
| Friday, January 1, 2016 | 11931821000 | 1603532000 |
| Sunday, January 1, 2017 | 13680857000 | 1928037000 |
| Monday, January 1, 2018 | 15269479000 | 1095014000 |
| Tuesday, January 1, 2019 | 14021726000 | 2073803000 |
| Wednesday, January 1, 2020 | 15037716000 | 3650727000 |
| Friday, January 1, 2021 | 21493659000 | 3773725000 |
| Saturday, January 1, 2022 | 22826428000 | 3778617000 |
| Sunday, January 1, 2023 | 16457570000 | 3727521000 |
| Monday, January 1, 2024 | 16416191000 | 3760116000 |
Unleashing the power of data
In the ever-evolving landscape of global commerce, understanding cost structures is crucial for strategic decision-making. This analysis delves into the cost of revenue trends for two industry giants: Global Payments Inc. and C.H. Robinson Worldwide, Inc., from 2014 to 2023.
C.H. Robinson Worldwide, Inc., a leader in logistics, has seen its cost of revenue fluctuate significantly, peaking in 2022 with a 64% increase from its 2014 figures. This reflects the dynamic nature of the logistics industry, where operational costs can be volatile. In contrast, Global Payments Inc., a major player in the financial services sector, experienced a steady rise, with costs more than tripling over the same period, highlighting the growing demand for digital payment solutions.
Notably, data for 2024 is absent, suggesting potential reporting delays or strategic shifts. This gap underscores the importance of continuous monitoring for informed business strategies.
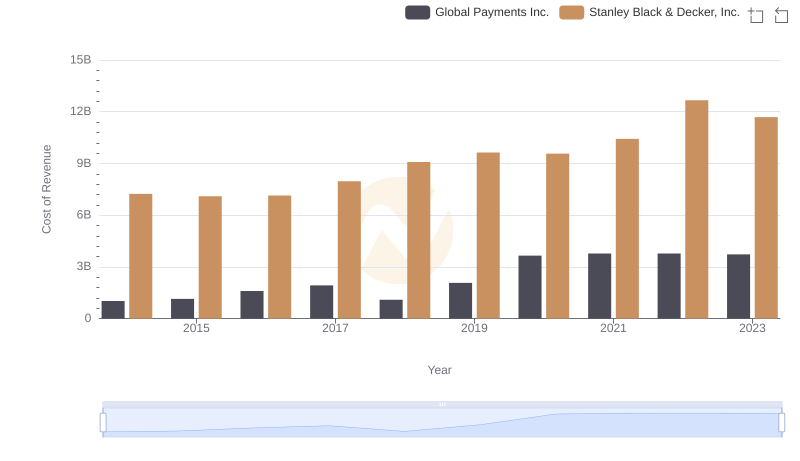
Cost of Revenue Trends: Global Payments Inc. vs Stanley Black & Decker, Inc.
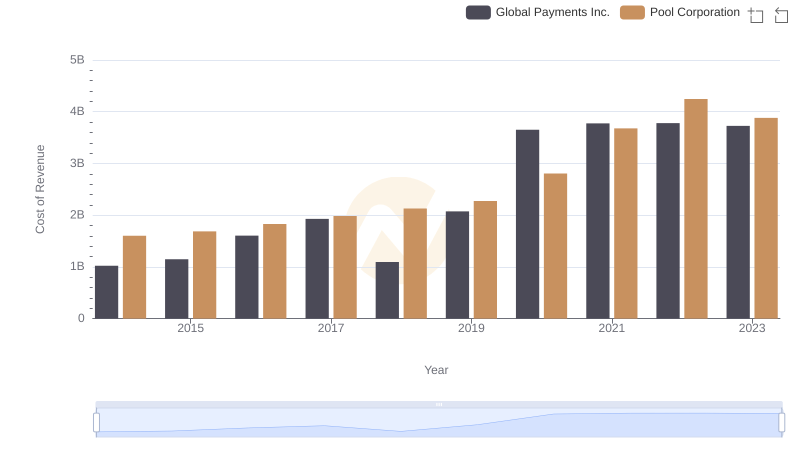
Global Payments Inc. vs Pool Corporation: Efficiency in Cost of Revenue Explored

Breaking Down Revenue Trends: Global Payments Inc. vs C.H. Robinson Worldwide, Inc.

Analyzing Cost of Revenue: Global Payments Inc. and U-Haul Holding Company
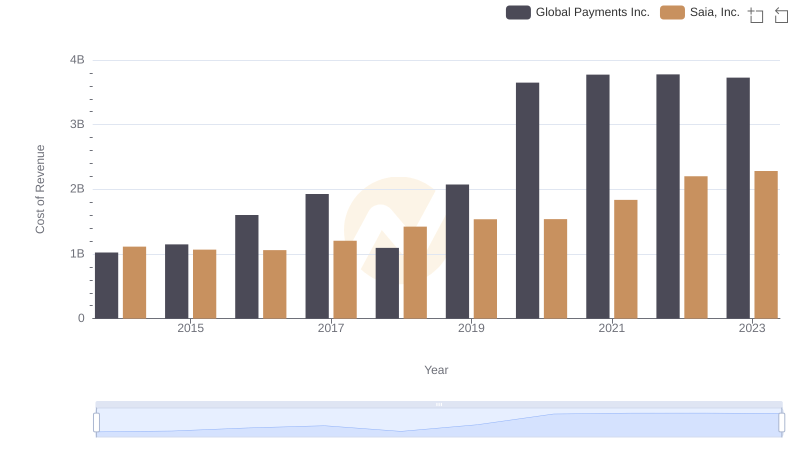
Global Payments Inc. vs Saia, Inc.: Efficiency in Cost of Revenue Explored
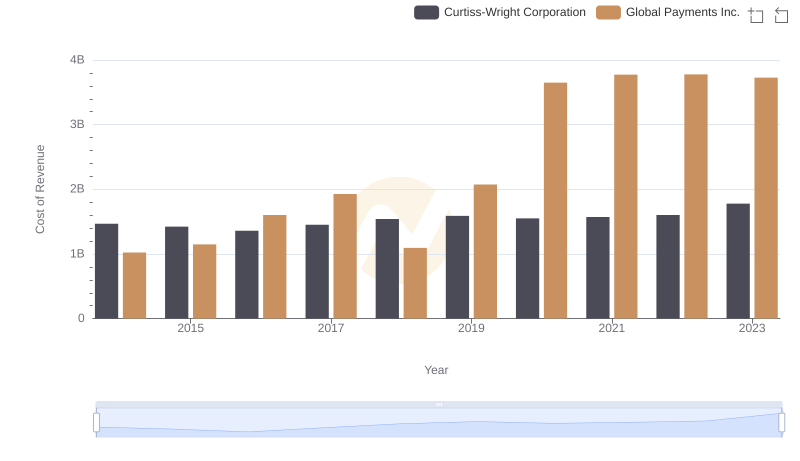
Analyzing Cost of Revenue: Global Payments Inc. and Curtiss-Wright Corporation
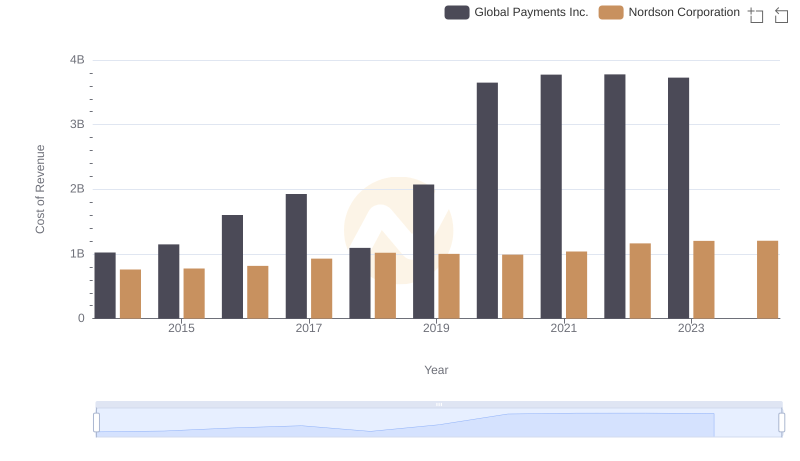
Cost of Revenue Trends: Global Payments Inc. vs Nordson Corporation
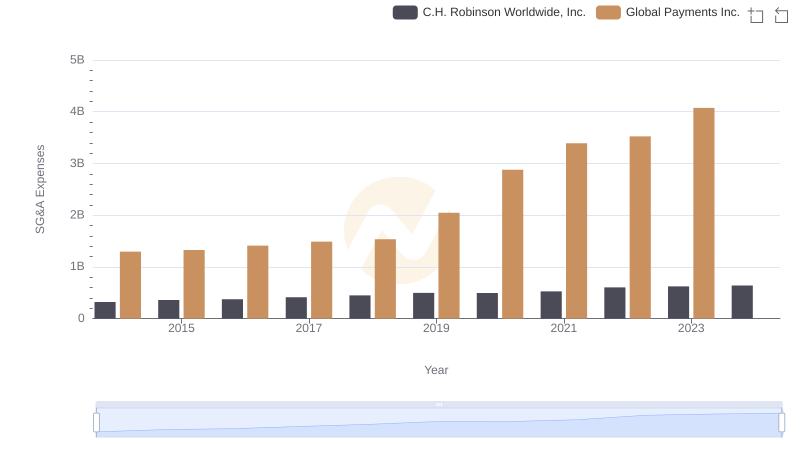
Who Optimizes SG&A Costs Better? Global Payments Inc. or C.H. Robinson Worldwide, Inc.
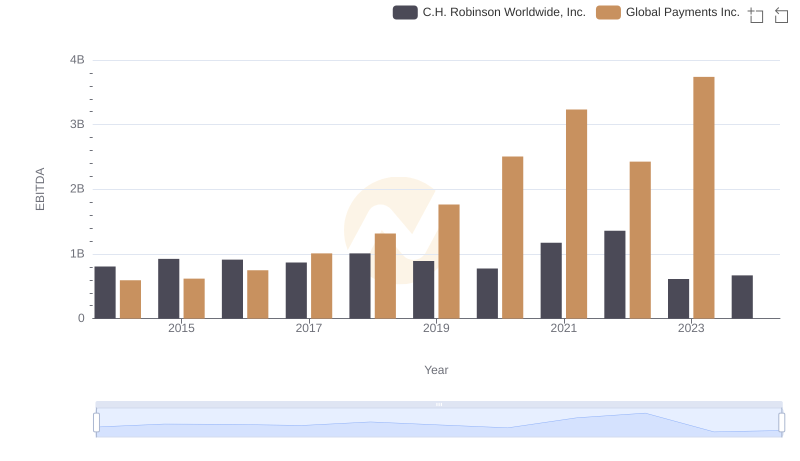
A Side-by-Side Analysis of EBITDA: Global Payments Inc. and C.H. Robinson Worldwide, Inc.