| __timestamp | Curtiss-Wright Corporation | Global Payments Inc. |
|---|---|---|
| Wednesday, January 1, 2014 | 1466610000 | 1022107000 |
| Thursday, January 1, 2015 | 1422428000 | 1147639000 |
| Friday, January 1, 2016 | 1358448000 | 1603532000 |
| Sunday, January 1, 2017 | 1452431000 | 1928037000 |
| Monday, January 1, 2018 | 1540574000 | 1095014000 |
| Tuesday, January 1, 2019 | 1589216000 | 2073803000 |
| Wednesday, January 1, 2020 | 1550109000 | 3650727000 |
| Friday, January 1, 2021 | 1572575000 | 3773725000 |
| Saturday, January 1, 2022 | 1602416000 | 3778617000 |
| Sunday, January 1, 2023 | 1778195000 | 3727521000 |
| Monday, January 1, 2024 | 1967640000 | 3760116000 |
Unleashing insights
In the ever-evolving landscape of corporate finance, understanding the cost of revenue is crucial for assessing a company's efficiency and profitability. This analysis delves into the financial journeys of Global Payments Inc. and Curtiss-Wright Corporation from 2014 to 2023. Over this period, Global Payments Inc. experienced a staggering 265% increase in its cost of revenue, peaking in 2022. In contrast, Curtiss-Wright Corporation maintained a more stable trajectory, with a modest 21% rise over the same period.
The data reveals that while Global Payments Inc. faced significant fluctuations, Curtiss-Wright Corporation's cost of revenue remained relatively steady, reflecting its consistent operational strategies. This comparison highlights the diverse financial strategies and market conditions impacting these two industry giants. As we move forward, understanding these trends will be vital for investors and analysts alike.
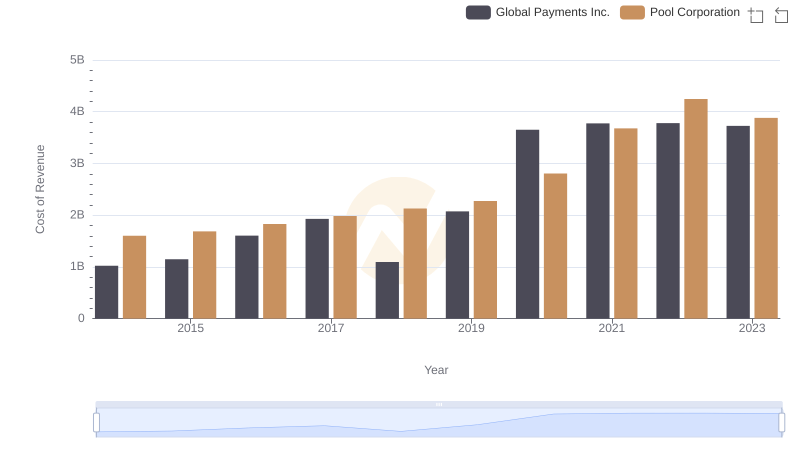
Global Payments Inc. vs Pool Corporation: Efficiency in Cost of Revenue Explored
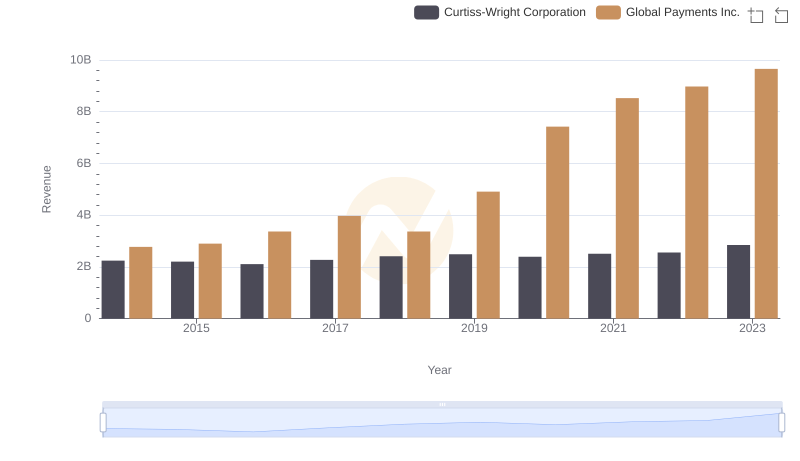
Annual Revenue Comparison: Global Payments Inc. vs Curtiss-Wright Corporation

Analyzing Cost of Revenue: Global Payments Inc. and U-Haul Holding Company
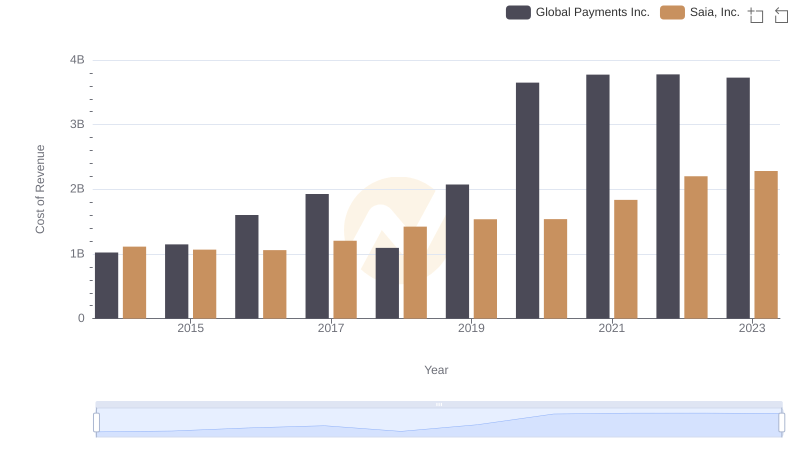
Global Payments Inc. vs Saia, Inc.: Efficiency in Cost of Revenue Explored
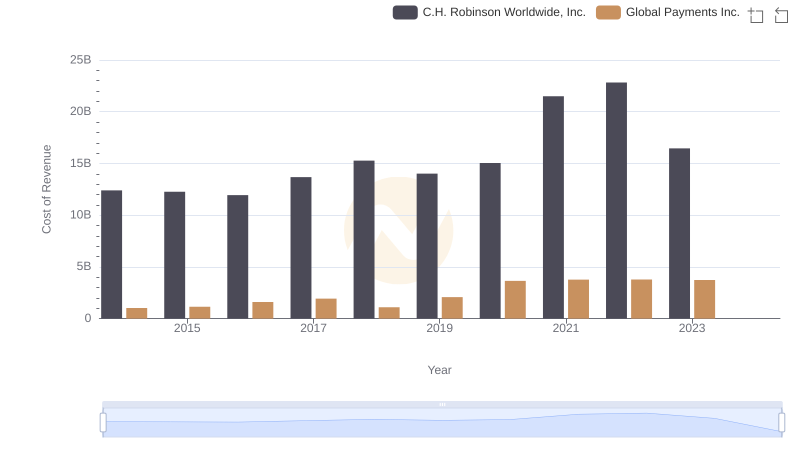
Cost of Revenue Trends: Global Payments Inc. vs C.H. Robinson Worldwide, Inc.
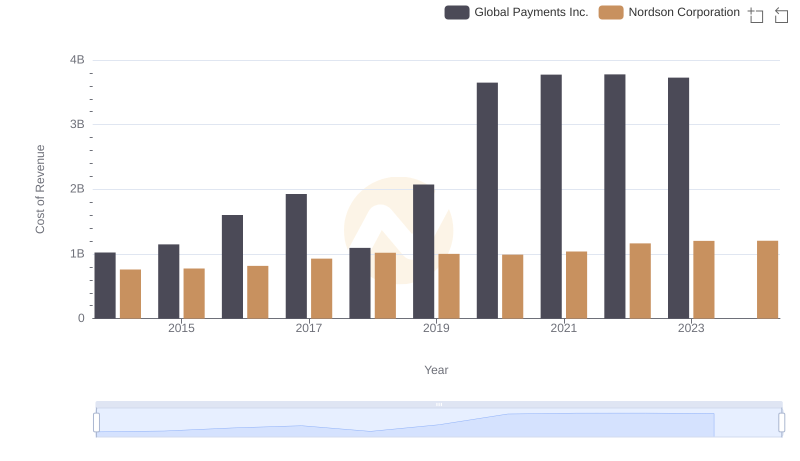
Cost of Revenue Trends: Global Payments Inc. vs Nordson Corporation
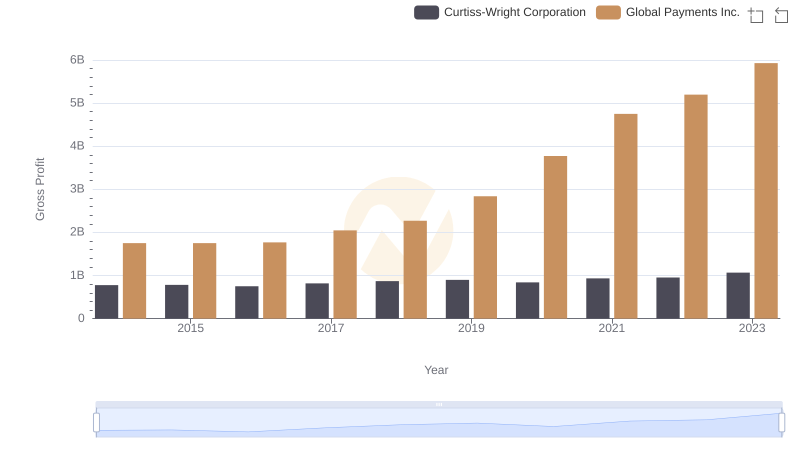
Global Payments Inc. vs Curtiss-Wright Corporation: A Gross Profit Performance Breakdown
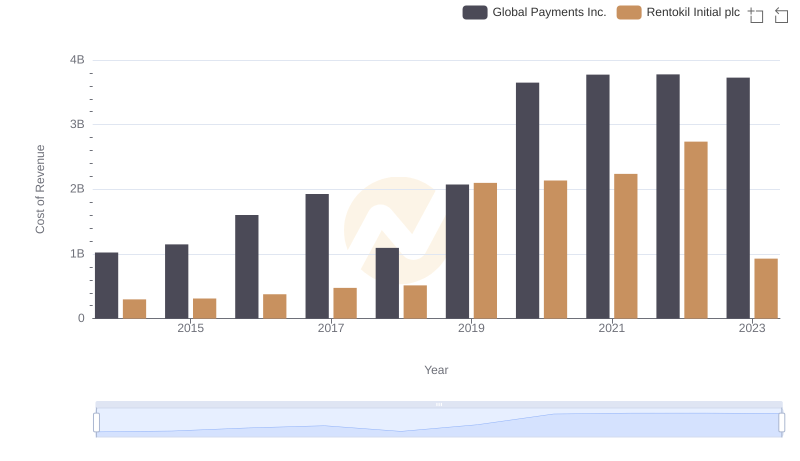
Analyzing Cost of Revenue: Global Payments Inc. and Rentokil Initial plc
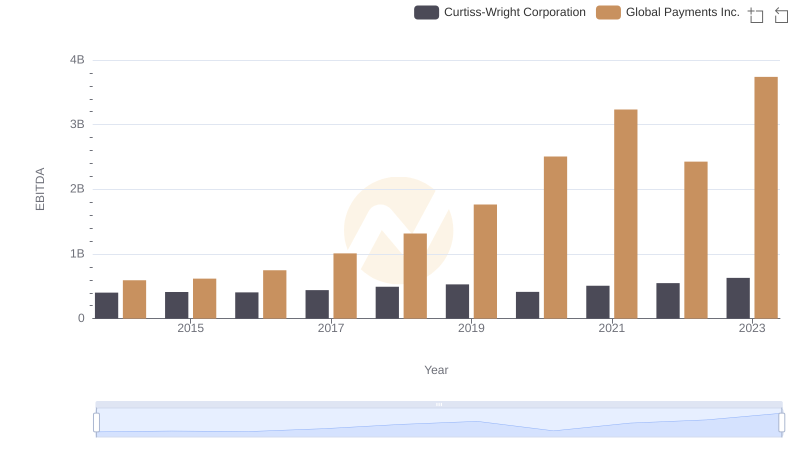
Professional EBITDA Benchmarking: Global Payments Inc. vs Curtiss-Wright Corporation