| __timestamp | Global Payments Inc. | Nordson Corporation |
|---|---|---|
| Wednesday, January 1, 2014 | 1022107000 | 758923000 |
| Thursday, January 1, 2015 | 1147639000 | 774702000 |
| Friday, January 1, 2016 | 1603532000 | 815495000 |
| Sunday, January 1, 2017 | 1928037000 | 927981000 |
| Monday, January 1, 2018 | 1095014000 | 1018703000 |
| Tuesday, January 1, 2019 | 2073803000 | 1002123000 |
| Wednesday, January 1, 2020 | 3650727000 | 990632000 |
| Friday, January 1, 2021 | 3773725000 | 1038129000 |
| Saturday, January 1, 2022 | 3778617000 | 1163742000 |
| Sunday, January 1, 2023 | 3727521000 | 1203227000 |
| Monday, January 1, 2024 | 3760116000 | 1203792000 |
Unleashing the power of data
In the ever-evolving landscape of global commerce, understanding cost structures is pivotal. This analysis delves into the cost of revenue trends for Global Payments Inc. and Nordson Corporation from 2014 to 2023. Over this decade, Global Payments Inc. has seen a staggering 265% increase in its cost of revenue, peaking in 2022. This reflects the company's aggressive expansion and adaptation to the digital payment revolution. In contrast, Nordson Corporation, a leader in precision technology, has maintained a steady growth trajectory, with a 58% rise over the same period. This stability underscores Nordson's strategic focus on innovation and efficiency. Notably, 2024 data for Global Payments Inc. is unavailable, hinting at potential shifts or reporting delays. As businesses navigate the complexities of modern markets, these insights offer a window into the strategic priorities and operational efficiencies of two industry giants.
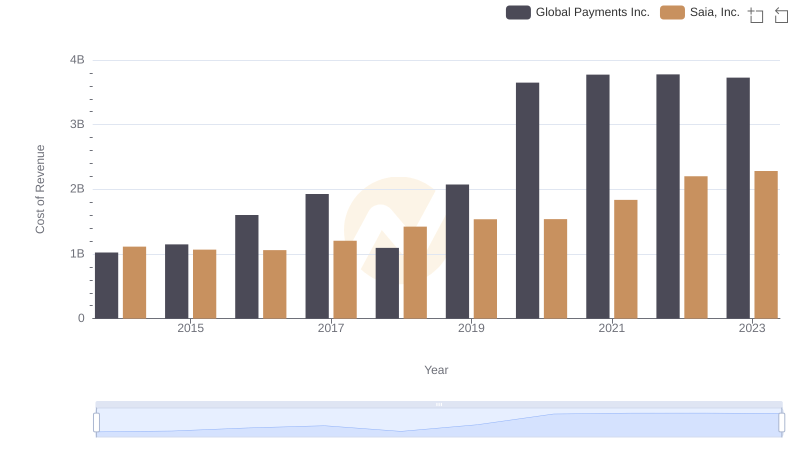
Global Payments Inc. vs Saia, Inc.: Efficiency in Cost of Revenue Explored
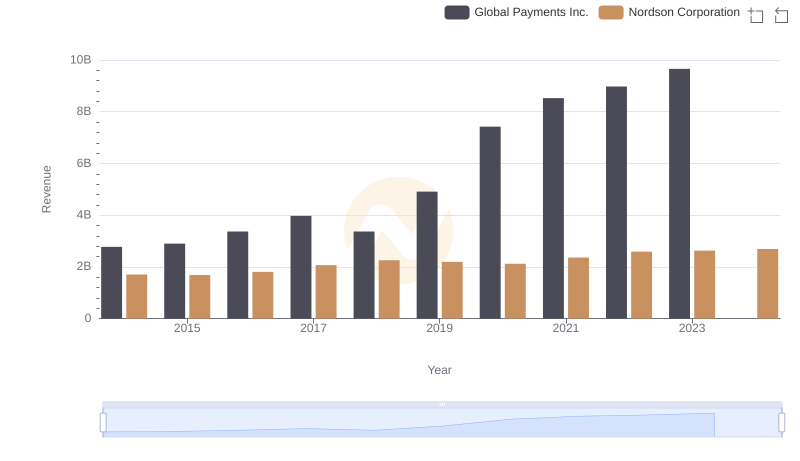
Global Payments Inc. vs Nordson Corporation: Examining Key Revenue Metrics
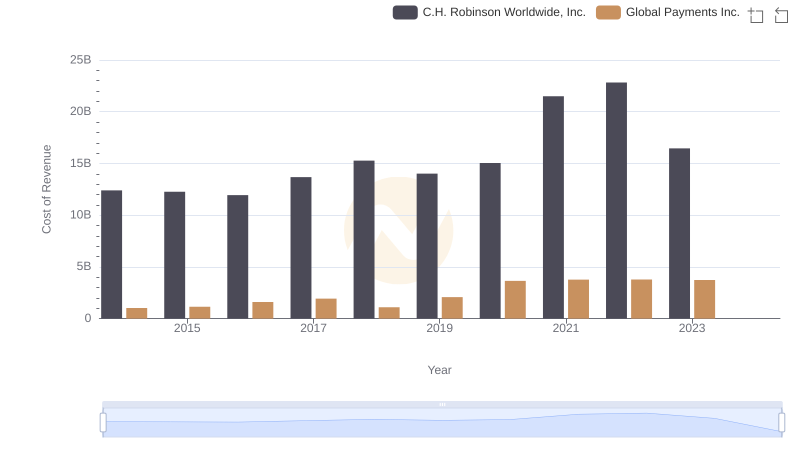
Cost of Revenue Trends: Global Payments Inc. vs C.H. Robinson Worldwide, Inc.
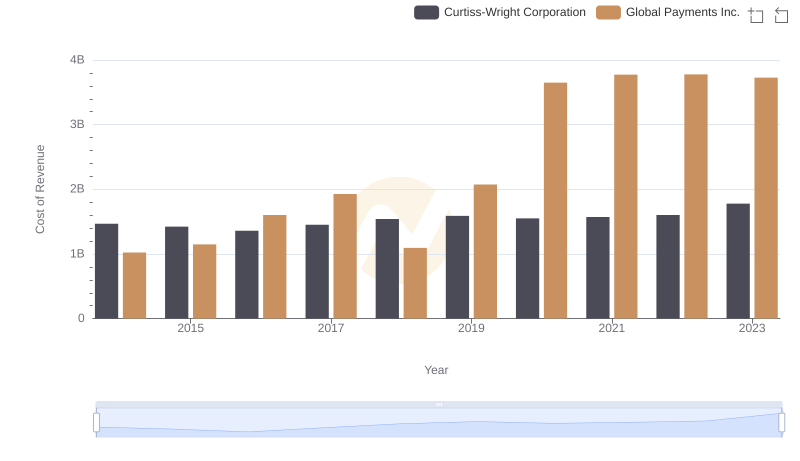
Analyzing Cost of Revenue: Global Payments Inc. and Curtiss-Wright Corporation
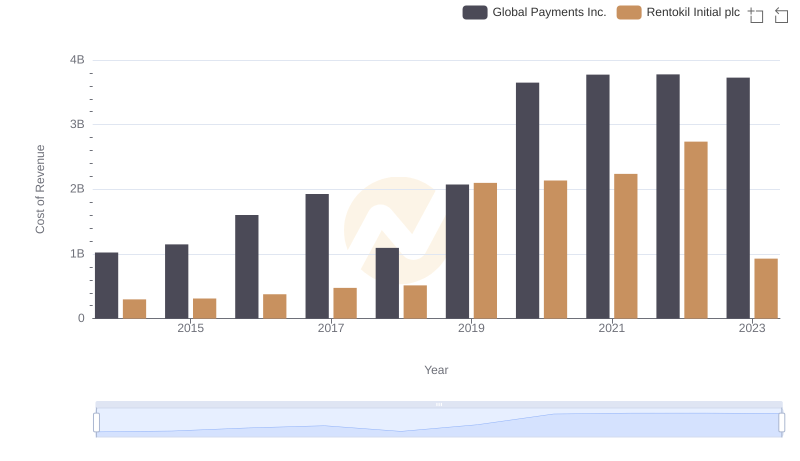
Analyzing Cost of Revenue: Global Payments Inc. and Rentokil Initial plc
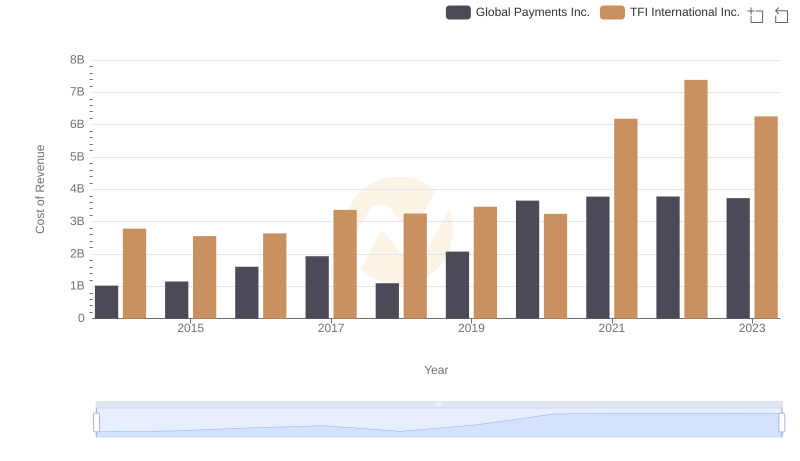
Global Payments Inc. vs TFI International Inc.: Efficiency in Cost of Revenue Explored
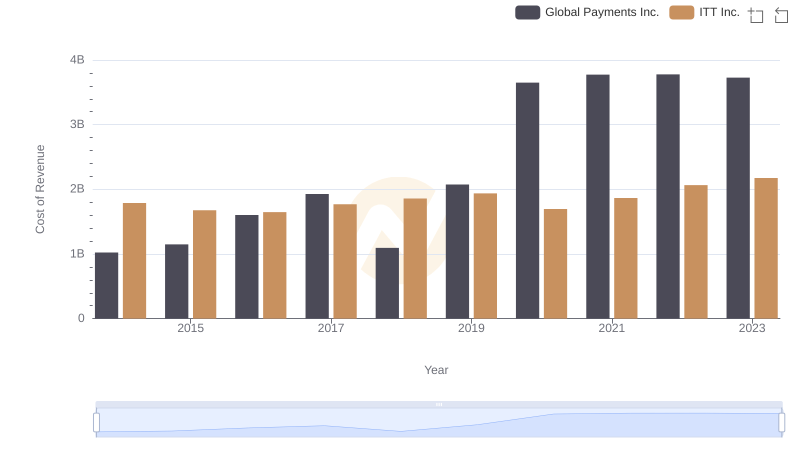
Cost of Revenue: Key Insights for Global Payments Inc. and ITT Inc.