| __timestamp | Global Payments Inc. | TFI International Inc. |
|---|---|---|
| Wednesday, January 1, 2014 | 1022107000 | 2782605137 |
| Thursday, January 1, 2015 | 1147639000 | 2551474032 |
| Friday, January 1, 2016 | 1603532000 | 2636493564 |
| Sunday, January 1, 2017 | 1928037000 | 3364979721 |
| Monday, January 1, 2018 | 1095014000 | 3251443800 |
| Tuesday, January 1, 2019 | 2073803000 | 3461987950 |
| Wednesday, January 1, 2020 | 3650727000 | 3239249000 |
| Friday, January 1, 2021 | 3773725000 | 6182566000 |
| Saturday, January 1, 2022 | 3778617000 | 7385640000 |
| Sunday, January 1, 2023 | 3727521000 | 6255775000 |
| Monday, January 1, 2024 | 3760116000 |
Infusing magic into the data realm
In the ever-evolving landscape of global commerce, understanding cost efficiency is paramount. This analysis delves into the cost of revenue trends for Global Payments Inc. and TFI International Inc. from 2014 to 2023. Over this period, TFI International Inc. consistently outpaced Global Payments Inc. in cost of revenue, peaking in 2022 with a staggering 7.39 billion, a 165% increase from 2014. In contrast, Global Payments Inc. saw a more modest growth, with its cost of revenue rising by approximately 266% over the same period, reaching 3.78 billion in 2022. This disparity highlights TFI International's aggressive expansion strategy, while Global Payments Inc. maintains a more conservative approach. As businesses navigate the complexities of the modern economy, these insights offer a glimpse into the strategic decisions shaping the future of these industry giants.
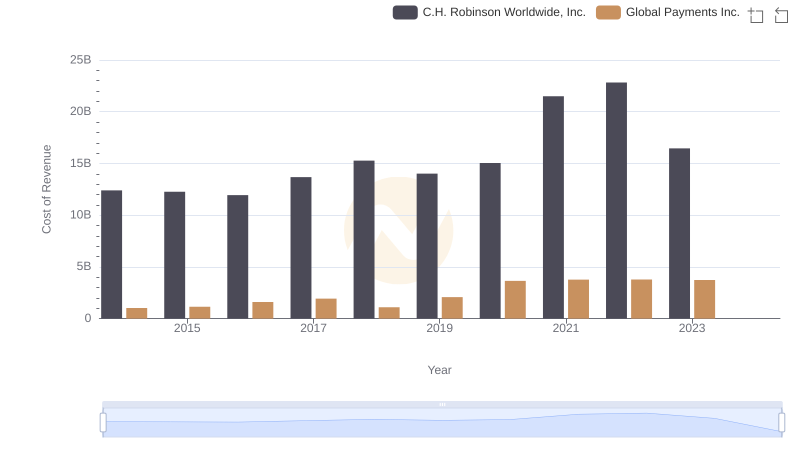
Cost of Revenue Trends: Global Payments Inc. vs C.H. Robinson Worldwide, Inc.
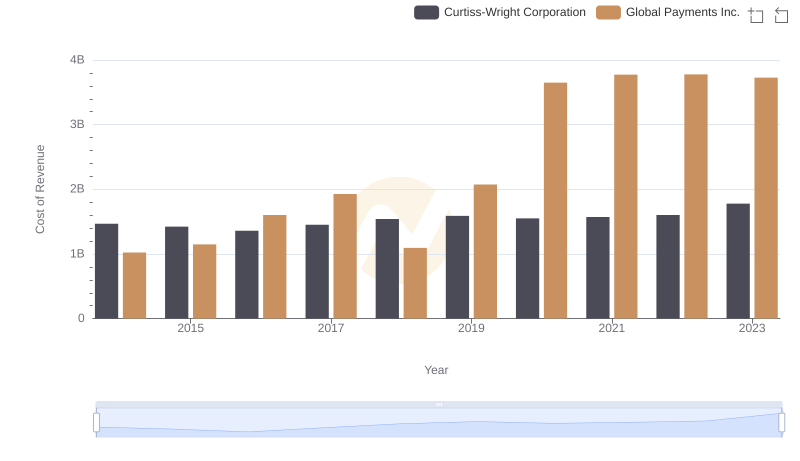
Analyzing Cost of Revenue: Global Payments Inc. and Curtiss-Wright Corporation
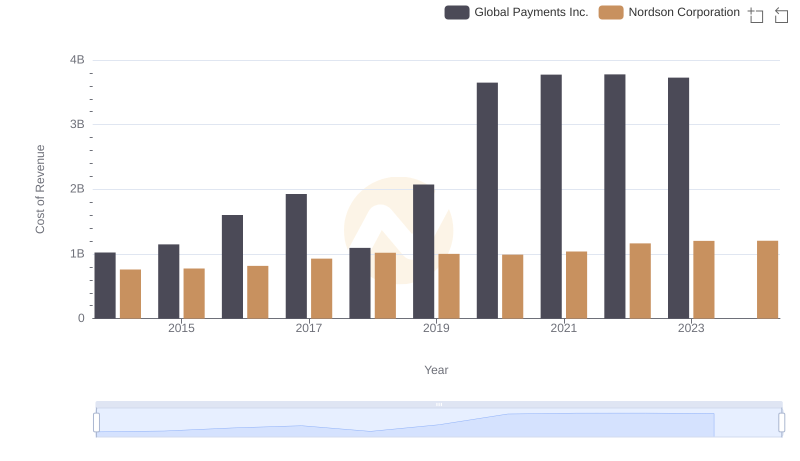
Cost of Revenue Trends: Global Payments Inc. vs Nordson Corporation
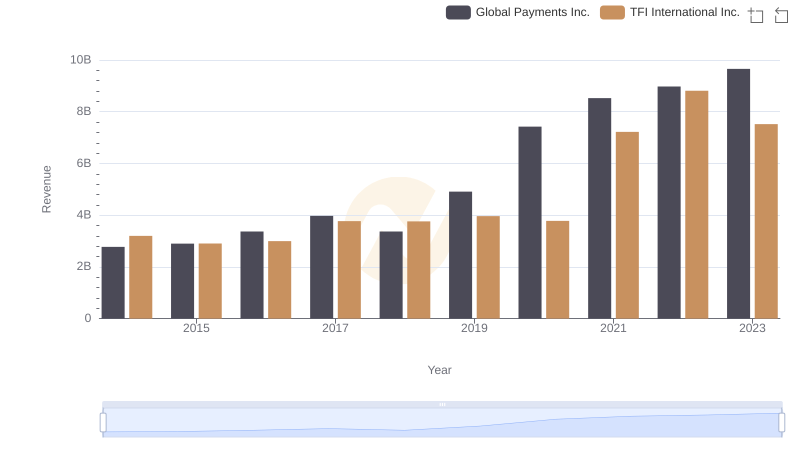
Global Payments Inc. vs TFI International Inc.: Annual Revenue Growth Compared
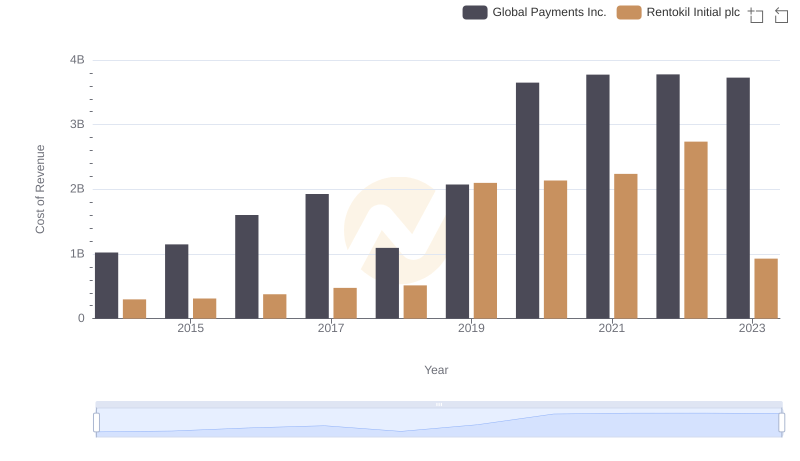
Analyzing Cost of Revenue: Global Payments Inc. and Rentokil Initial plc
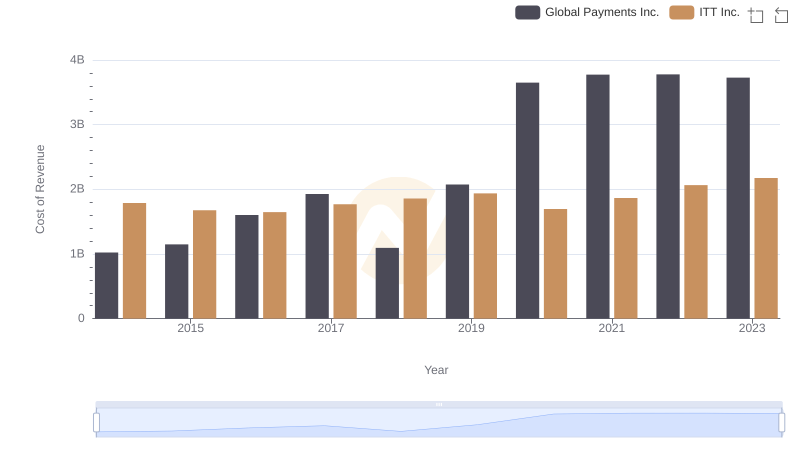
Cost of Revenue: Key Insights for Global Payments Inc. and ITT Inc.
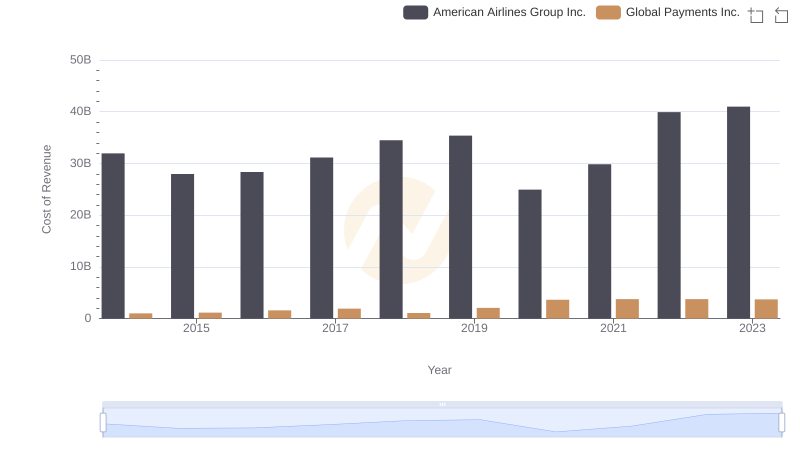
Cost of Revenue Trends: Global Payments Inc. vs American Airlines Group Inc.
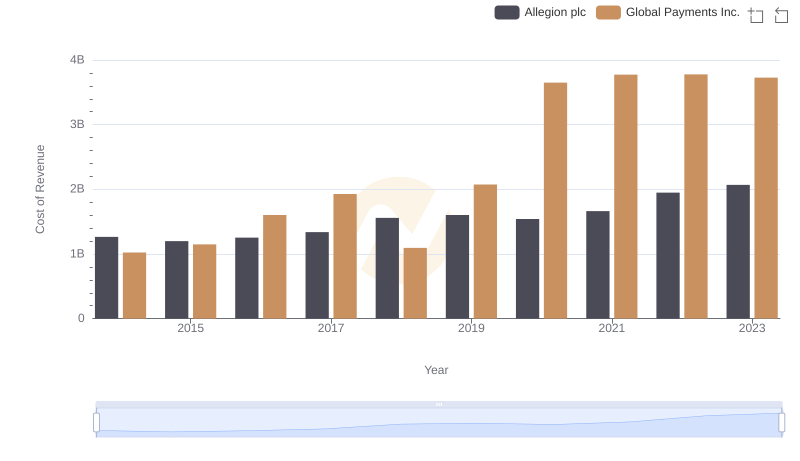
Cost of Revenue Trends: Global Payments Inc. vs Allegion plc
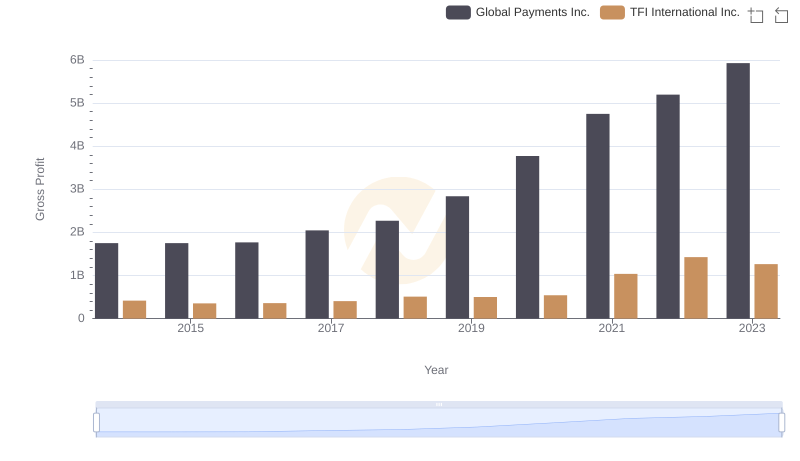
Gross Profit Comparison: Global Payments Inc. and TFI International Inc. Trends