| __timestamp | CNH Industrial N.V. | Equifax Inc. |
|---|---|---|
| Wednesday, January 1, 2014 | 25534000000 | 844700000 |
| Thursday, January 1, 2015 | 20357000000 | 887400000 |
| Friday, January 1, 2016 | 19539000000 | 1113400000 |
| Sunday, January 1, 2017 | 21621000000 | 1210700000 |
| Monday, January 1, 2018 | 22958000000 | 1440400000 |
| Tuesday, January 1, 2019 | 21832000000 | 1521700000 |
| Wednesday, January 1, 2020 | 21327000000 | 1737400000 |
| Friday, January 1, 2021 | 25951000000 | 1980900000 |
| Saturday, January 1, 2022 | 16797000000 | 2177200000 |
| Sunday, January 1, 2023 | 16805000000 | 2335100000 |
| Monday, January 1, 2024 | 0 |
Unleashing the power of data
In the ever-evolving landscape of global business, understanding cost structures is crucial. This analysis delves into the cost of revenue trends for Equifax Inc. and CNH Industrial N.V. from 2014 to 2023. Over this period, CNH Industrial N.V. consistently reported higher costs, peaking in 2021 with a 30% increase from 2016. In contrast, Equifax Inc. demonstrated a steady rise, with costs nearly tripling by 2023 compared to 2014. This divergence highlights the distinct operational strategies and market conditions faced by these industry giants. While CNH Industrial N.V. experienced fluctuations, Equifax Inc.'s growth trajectory suggests a strategic expansion or increased operational costs. These insights offer a window into the financial health and strategic priorities of these companies, providing valuable context for investors and analysts alike.
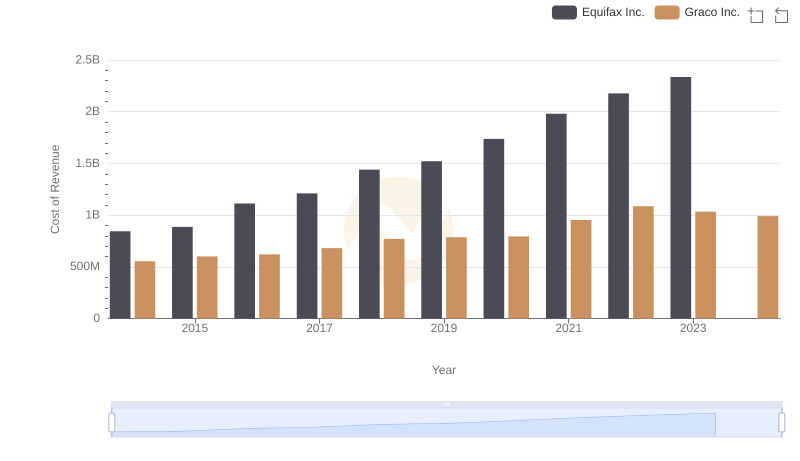
Analyzing Cost of Revenue: Equifax Inc. and Graco Inc.
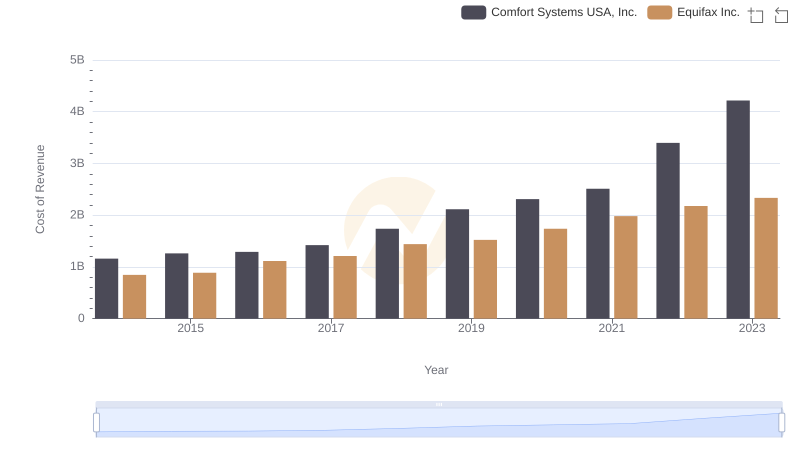
Analyzing Cost of Revenue: Equifax Inc. and Comfort Systems USA, Inc.
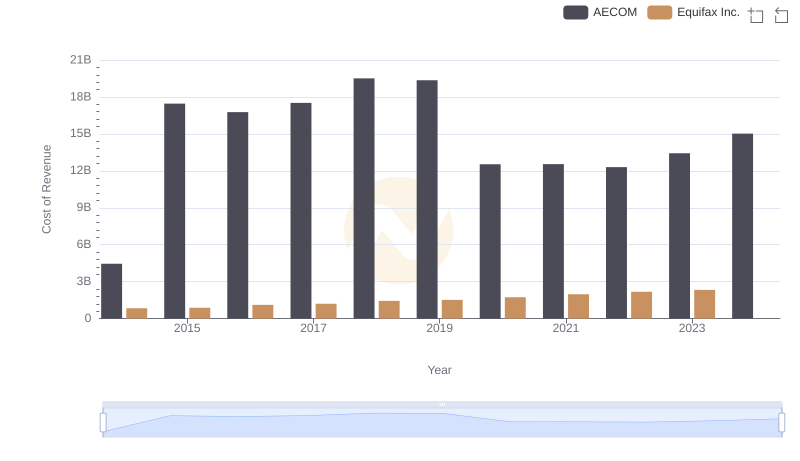
Equifax Inc. vs AECOM: Efficiency in Cost of Revenue Explored
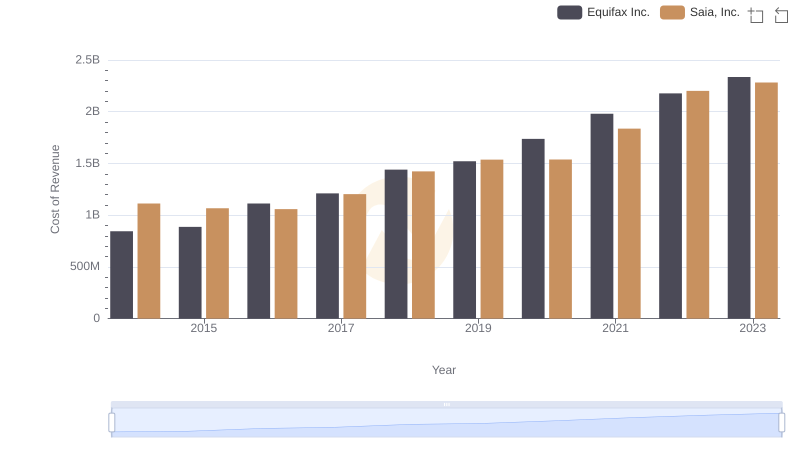
Analyzing Cost of Revenue: Equifax Inc. and Saia, Inc.
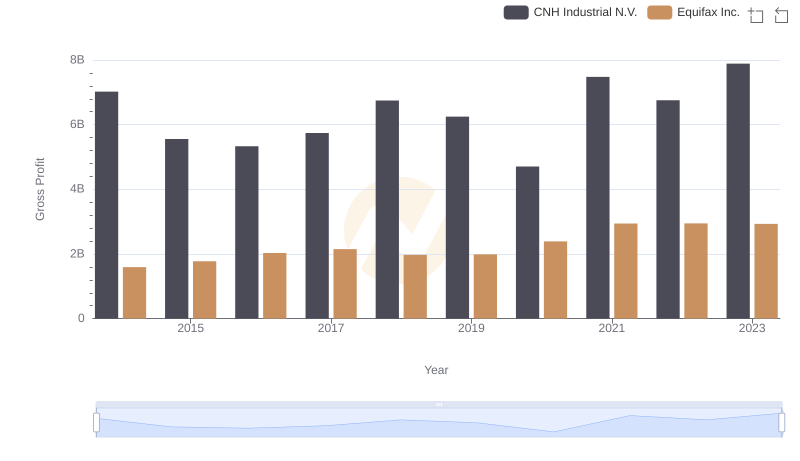
Gross Profit Analysis: Comparing Equifax Inc. and CNH Industrial N.V.
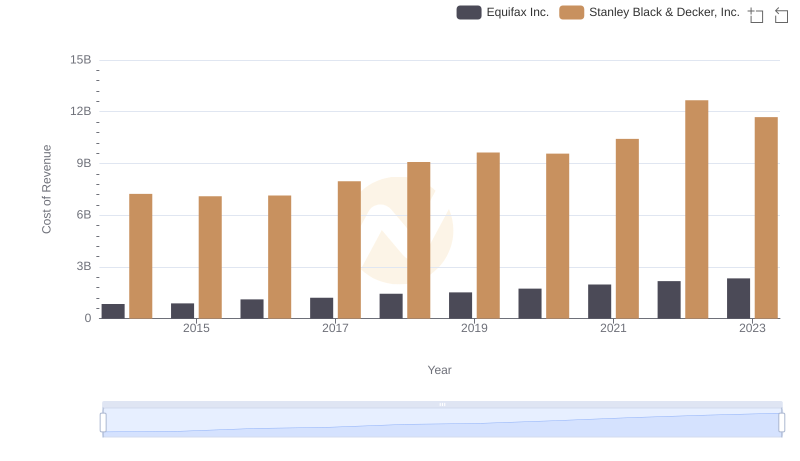
Cost of Revenue Trends: Equifax Inc. vs Stanley Black & Decker, Inc.
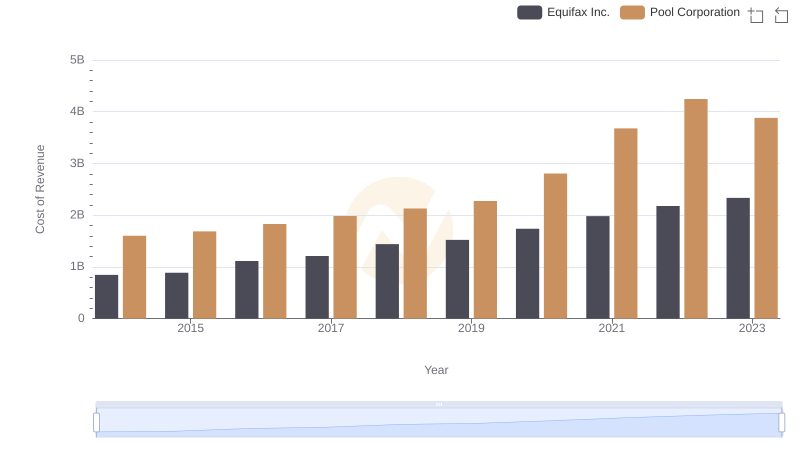
Cost of Revenue Comparison: Equifax Inc. vs Pool Corporation
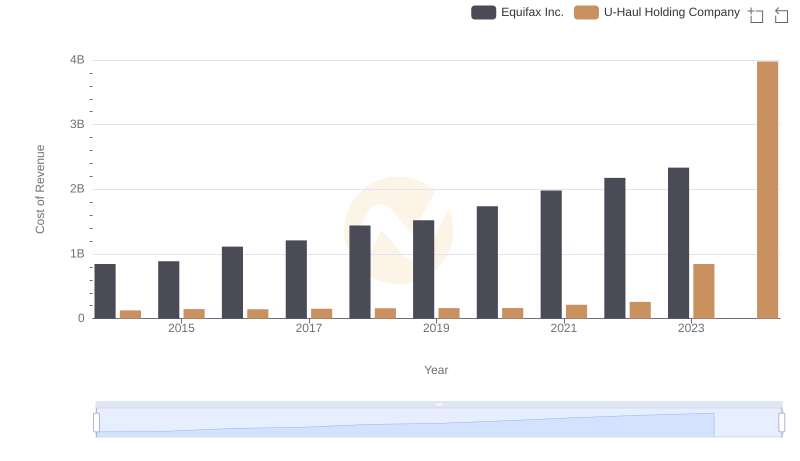
Cost of Revenue Comparison: Equifax Inc. vs U-Haul Holding Company
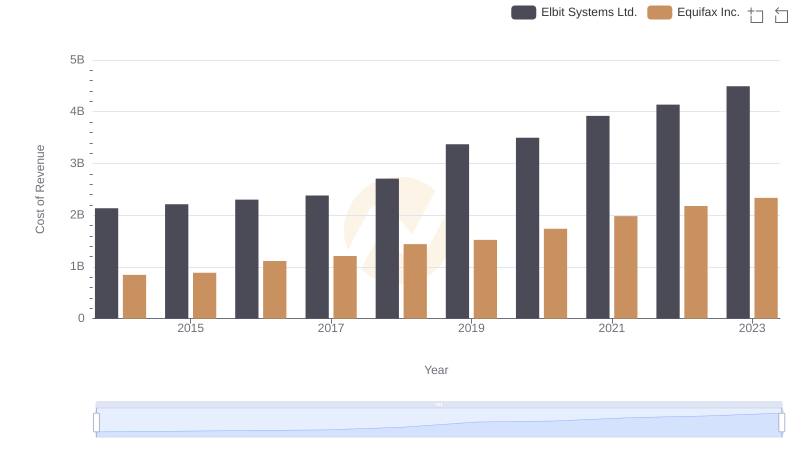
Cost of Revenue Comparison: Equifax Inc. vs Elbit Systems Ltd.
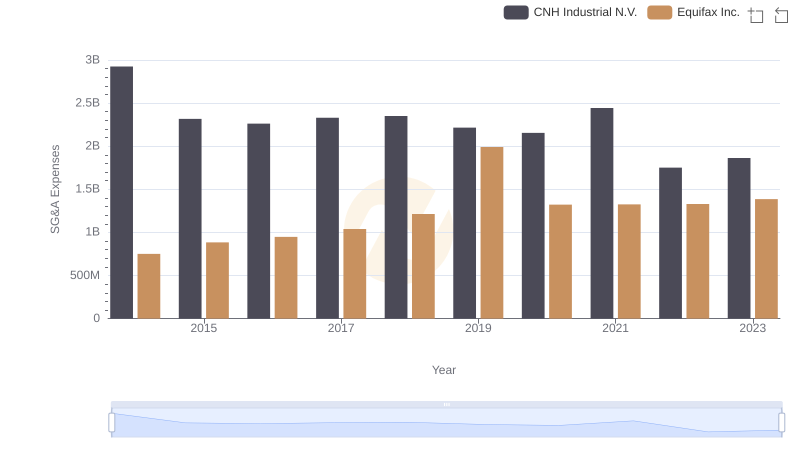
SG&A Efficiency Analysis: Comparing Equifax Inc. and CNH Industrial N.V.
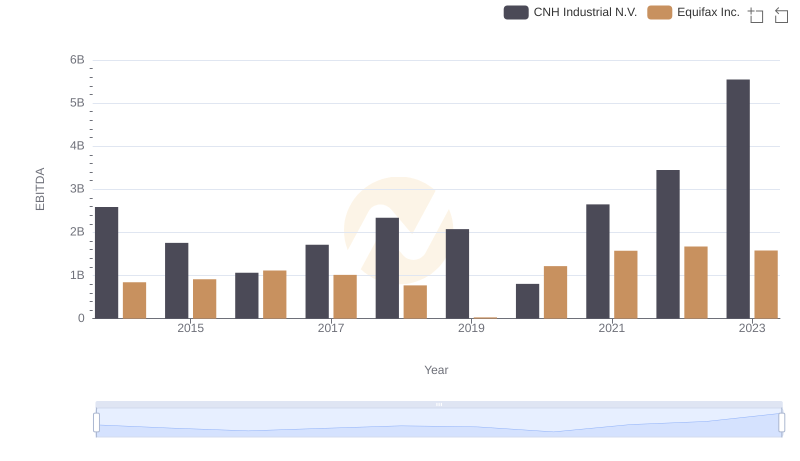
Comparative EBITDA Analysis: Equifax Inc. vs CNH Industrial N.V.