| __timestamp | Equifax Inc. | Graco Inc. |
|---|---|---|
| Wednesday, January 1, 2014 | 844700000 | 554394000 |
| Thursday, January 1, 2015 | 887400000 | 601785000 |
| Friday, January 1, 2016 | 1113400000 | 621054000 |
| Sunday, January 1, 2017 | 1210700000 | 681695000 |
| Monday, January 1, 2018 | 1440400000 | 770753000 |
| Tuesday, January 1, 2019 | 1521700000 | 786289000 |
| Wednesday, January 1, 2020 | 1737400000 | 795178000 |
| Friday, January 1, 2021 | 1980900000 | 953659000 |
| Saturday, January 1, 2022 | 2177200000 | 1086082000 |
| Sunday, January 1, 2023 | 2335100000 | 1034585000 |
| Monday, January 1, 2024 | 0 | 990855000 |
Unleashing the power of data
In the ever-evolving landscape of corporate finance, understanding the cost of revenue is crucial for evaluating a company's efficiency and profitability. This analysis delves into the cost of revenue trends for Equifax Inc. and Graco Inc. from 2014 to 2023. Over this period, Equifax Inc. has seen a remarkable increase of approximately 176% in its cost of revenue, reflecting its expanding operations and market reach. In contrast, Graco Inc. experienced a more modest growth of around 87%, indicating steady but less aggressive expansion.
The data reveals that Equifax consistently outpaces Graco in terms of cost of revenue, with a peak in 2023. However, the 2024 data for Equifax is missing, leaving room for speculation about its future trajectory. This comparative analysis offers valuable insights into the financial strategies and market positioning of these two industry giants.
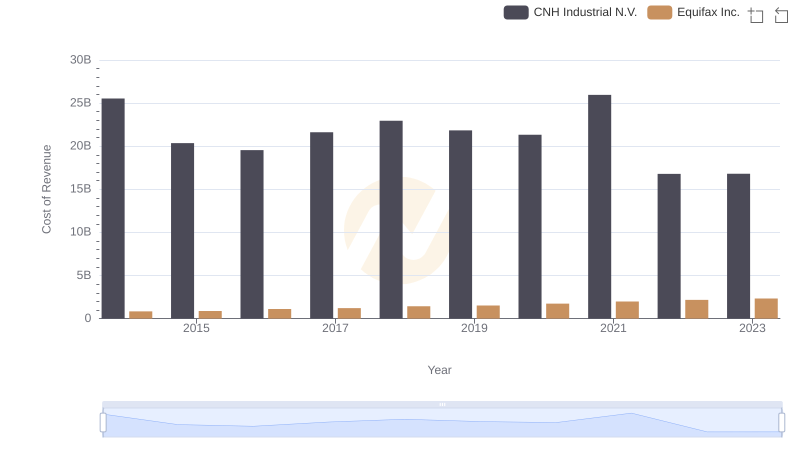
Cost of Revenue Trends: Equifax Inc. vs CNH Industrial N.V.
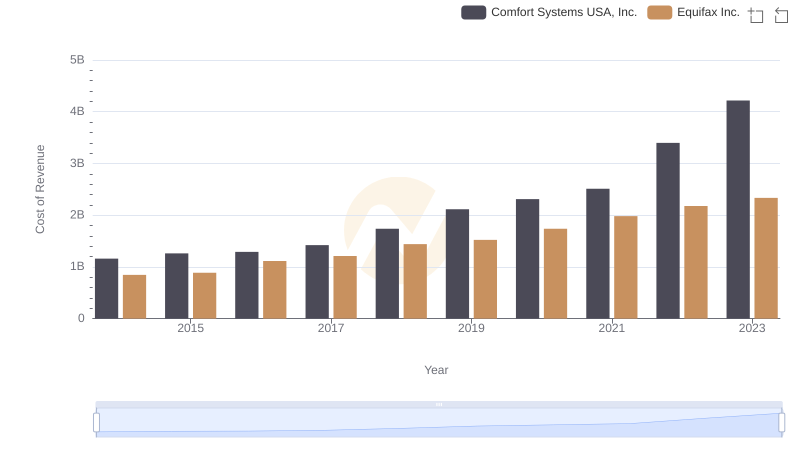
Analyzing Cost of Revenue: Equifax Inc. and Comfort Systems USA, Inc.
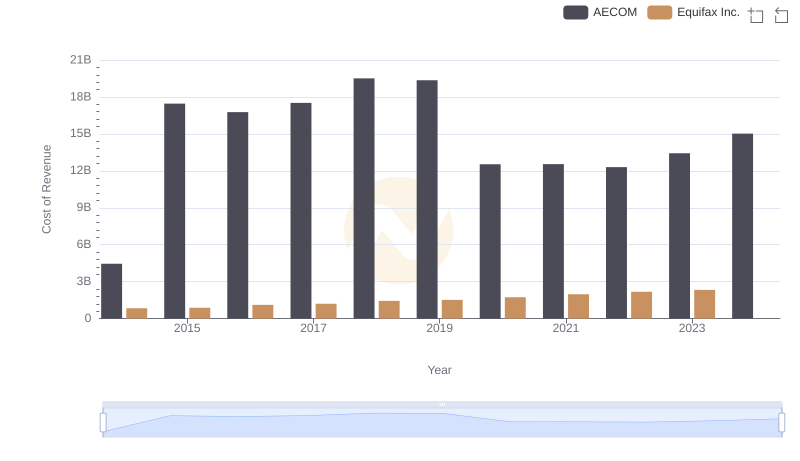
Equifax Inc. vs AECOM: Efficiency in Cost of Revenue Explored
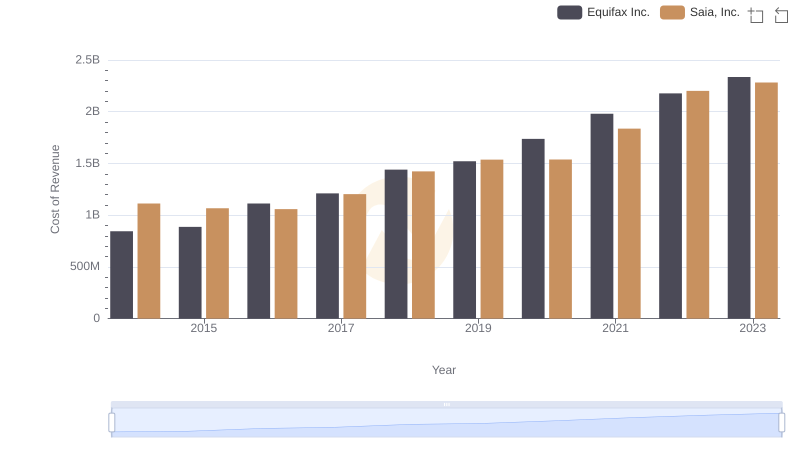
Analyzing Cost of Revenue: Equifax Inc. and Saia, Inc.
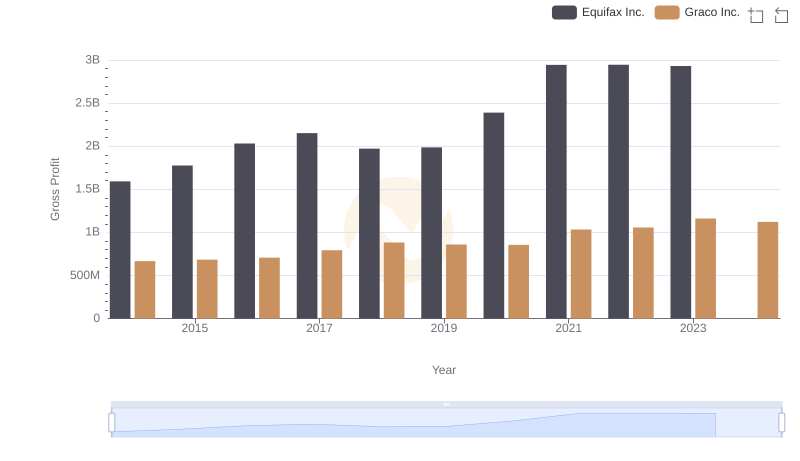
Who Generates Higher Gross Profit? Equifax Inc. or Graco Inc.
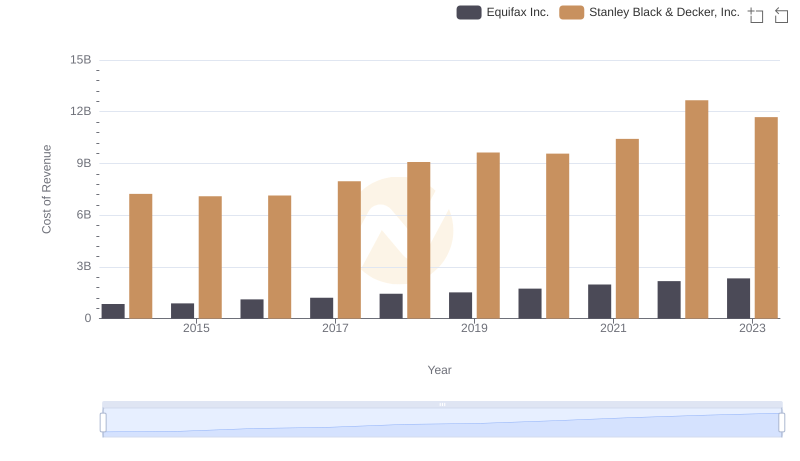
Cost of Revenue Trends: Equifax Inc. vs Stanley Black & Decker, Inc.
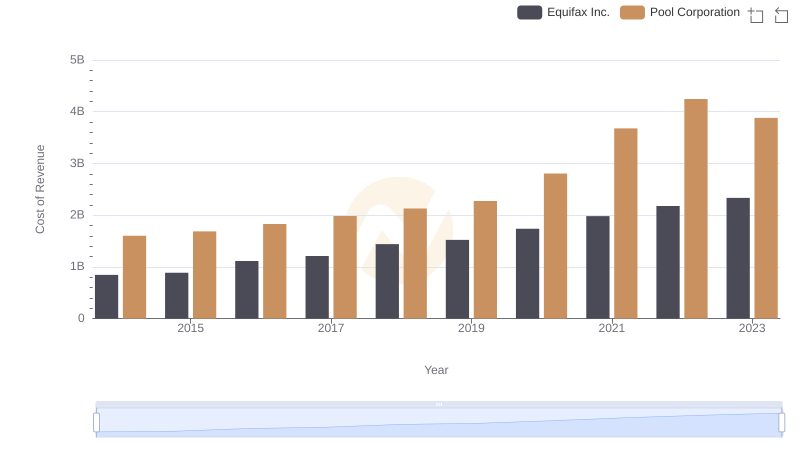
Cost of Revenue Comparison: Equifax Inc. vs Pool Corporation
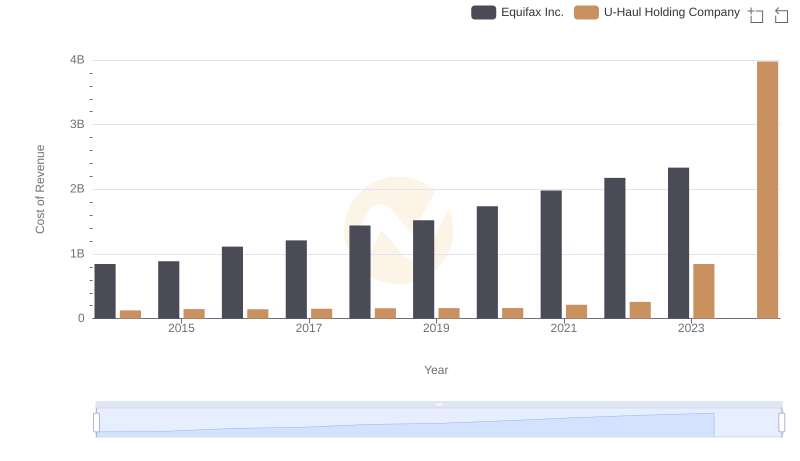
Cost of Revenue Comparison: Equifax Inc. vs U-Haul Holding Company
Who Optimizes SG&A Costs Better? Equifax Inc. or Graco Inc.