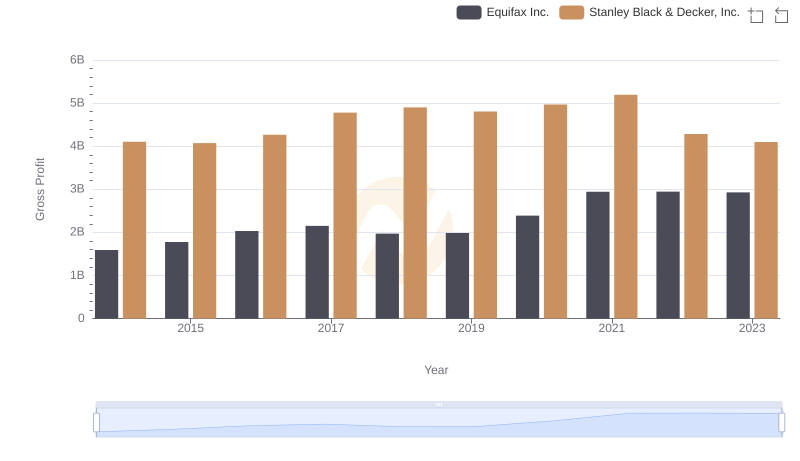
| __timestamp | Equifax Inc. | Stanley Black & Decker, Inc. |
|---|---|---|
| Wednesday, January 1, 2014 | 844700000 | 7235900000 |
| Thursday, January 1, 2015 | 887400000 | 7099800000 |
| Friday, January 1, 2016 | 1113400000 | 7139700000 |
| Sunday, January 1, 2017 | 1210700000 | 7969200000 |
| Monday, January 1, 2018 | 1440400000 | 9080500000 |
| Tuesday, January 1, 2019 | 1521700000 | 9636700000 |
| Wednesday, January 1, 2020 | 1737400000 | 9566700000 |
| Friday, January 1, 2021 | 1980900000 | 10423000000 |
| Saturday, January 1, 2022 | 2177200000 | 12663300000 |
| Sunday, January 1, 2023 | 2335100000 | 11683100000 |
| Monday, January 1, 2024 | 0 | 10851300000 |
Unleashing the power of data
In the ever-evolving landscape of corporate America, understanding cost structures is pivotal. Equifax Inc. and Stanley Black & Decker, Inc., two titans in their respective industries, offer a fascinating study in cost of revenue trends over the past decade.
From 2014 to 2023, Equifax's cost of revenue surged by approximately 176%, reflecting its strategic investments and expansion efforts. In contrast, Stanley Black & Decker, Inc. experienced a 61% increase, showcasing its robust operational efficiency. Notably, 2022 marked a peak year for both companies, with Equifax reaching 2.18 billion and Stanley Black & Decker, Inc. hitting 12.66 billion in cost of revenue.
These trends underscore the dynamic nature of cost management in different sectors, offering valuable insights for investors and industry analysts alike. As we look to the future, monitoring these trends will be crucial for understanding the financial health and strategic direction of these industry leaders.
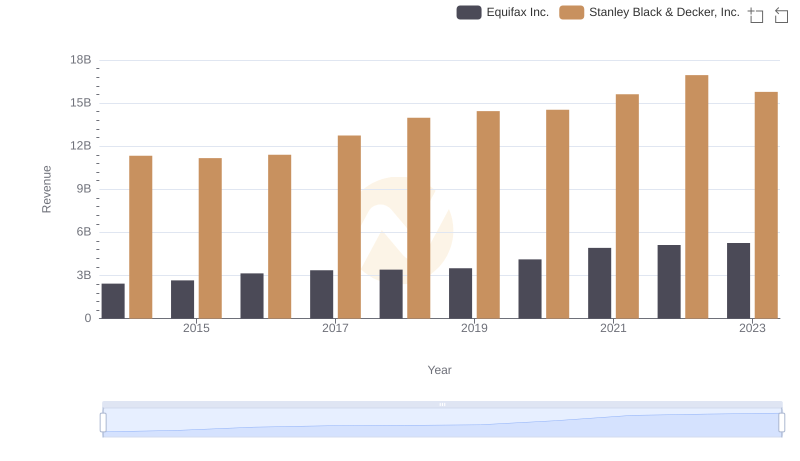
Equifax Inc. or Stanley Black & Decker, Inc.: Who Leads in Yearly Revenue?
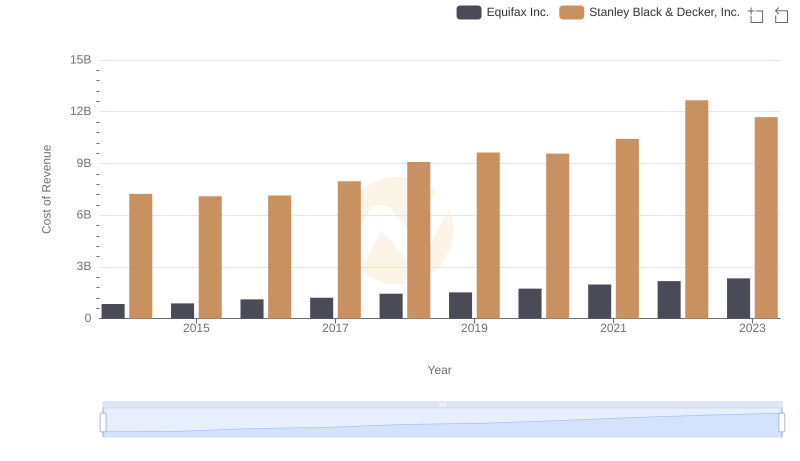
Cost Insights: Breaking Down Equifax Inc. and Stanley Black & Decker, Inc.'s Expenses

Equifax Inc. vs Stanley Black & Decker, Inc.: A Gross Profit Performance Breakdown
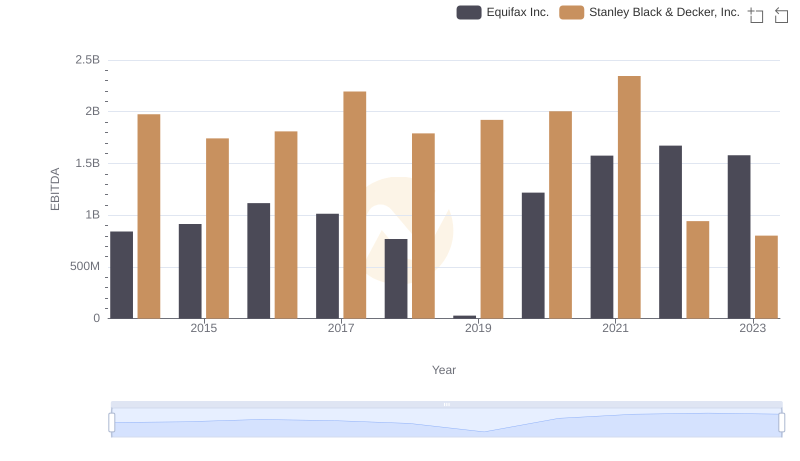
Comparative EBITDA Analysis: Equifax Inc. vs Stanley Black & Decker, Inc.
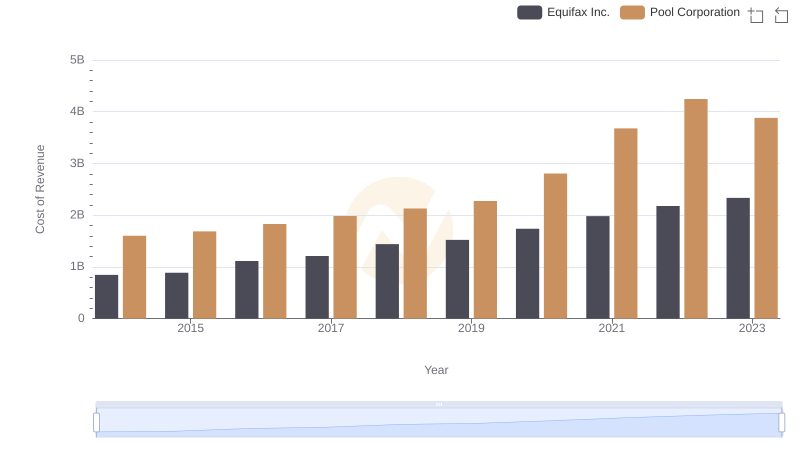
Cost of Revenue Comparison: Equifax Inc. vs Pool Corporation
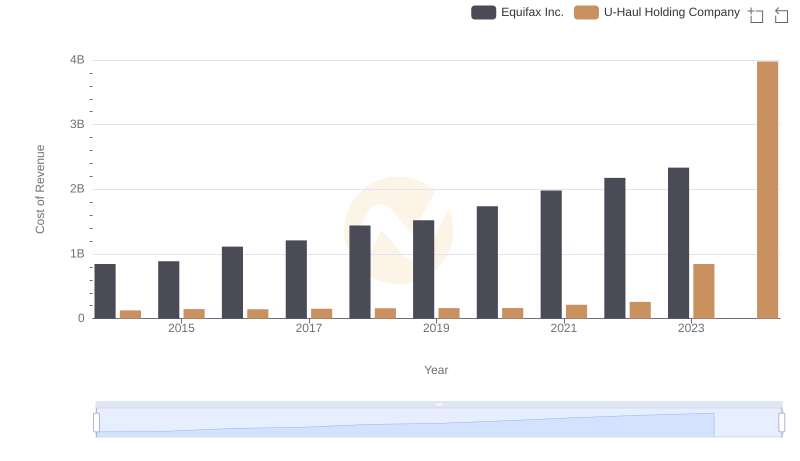
Cost of Revenue Comparison: Equifax Inc. vs U-Haul Holding Company
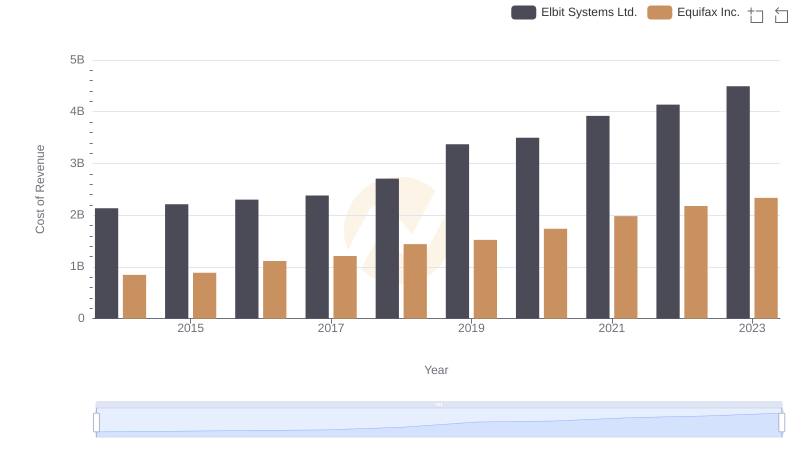
Cost of Revenue Comparison: Equifax Inc. vs Elbit Systems Ltd.
Key Insights on Gross Profit: Equifax Inc. vs Stanley Black & Decker, Inc.