| __timestamp | CNH Industrial N.V. | Equifax Inc. |
|---|---|---|
| Wednesday, January 1, 2014 | 2925000000 | 751700000 |
| Thursday, January 1, 2015 | 2317000000 | 884300000 |
| Friday, January 1, 2016 | 2262000000 | 948200000 |
| Sunday, January 1, 2017 | 2330000000 | 1039100000 |
| Monday, January 1, 2018 | 2351000000 | 1213300000 |
| Tuesday, January 1, 2019 | 2216000000 | 1990200000 |
| Wednesday, January 1, 2020 | 2155000000 | 1322500000 |
| Friday, January 1, 2021 | 2443000000 | 1324600000 |
| Saturday, January 1, 2022 | 1752000000 | 1328900000 |
| Sunday, January 1, 2023 | 1863000000 | 1385700000 |
| Monday, January 1, 2024 | 1450500000 |
Data in motion
In the world of corporate finance, Selling, General, and Administrative (SG&A) expenses are a critical measure of operational efficiency. This analysis compares the SG&A expenses of Equifax Inc. and CNH Industrial N.V. over a decade, from 2014 to 2023.
Equifax Inc. has shown a consistent increase in SG&A expenses, peaking in 2019 with a 165% rise from 2014. Despite a slight dip in 2020, the company maintained a steady upward trend, reflecting its strategic investments in growth and innovation.
Conversely, CNH Industrial N.V. experienced a more volatile journey. Starting with the highest SG&A expenses in 2014, the company saw a significant 40% drop by 2022. This fluctuation indicates a strategic shift towards cost optimization and efficiency.
This comparative analysis highlights the diverse strategies of these two industry giants in managing their operational costs.
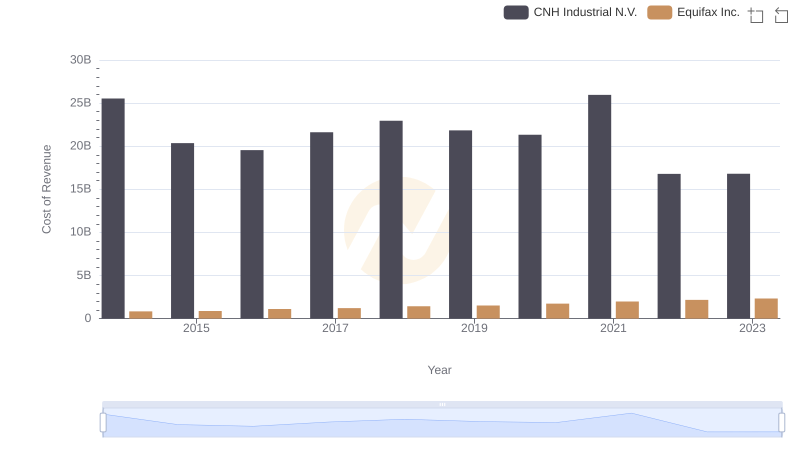
Cost of Revenue Trends: Equifax Inc. vs CNH Industrial N.V.
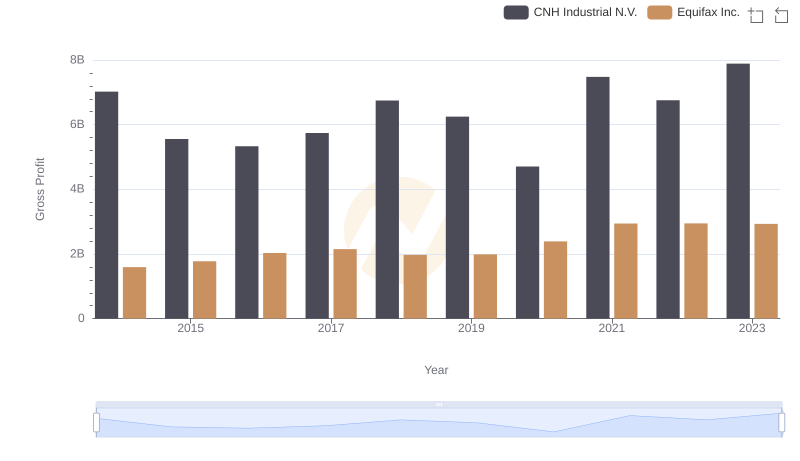
Gross Profit Analysis: Comparing Equifax Inc. and CNH Industrial N.V.
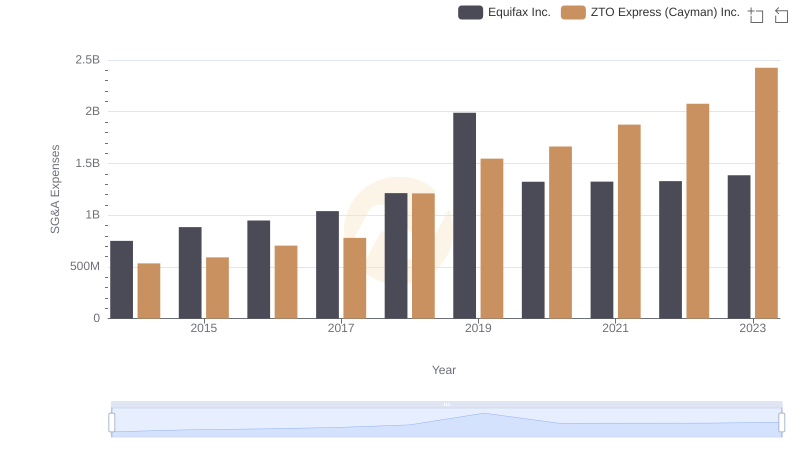
Who Optimizes SG&A Costs Better? Equifax Inc. or ZTO Express (Cayman) Inc.
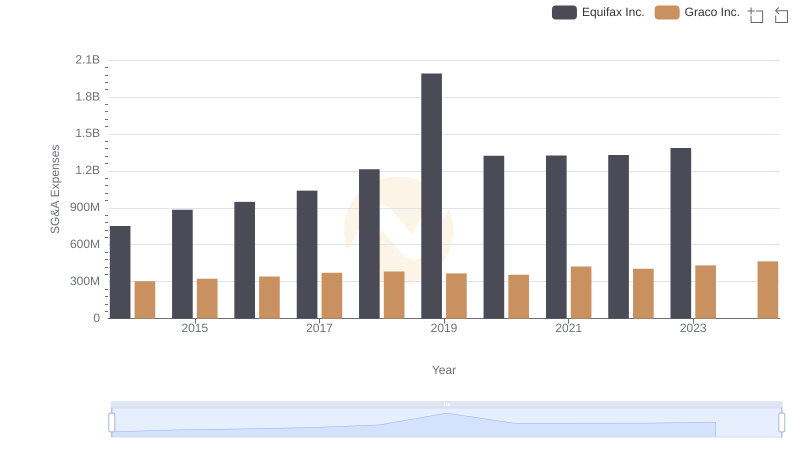
Who Optimizes SG&A Costs Better? Equifax Inc. or Graco Inc.
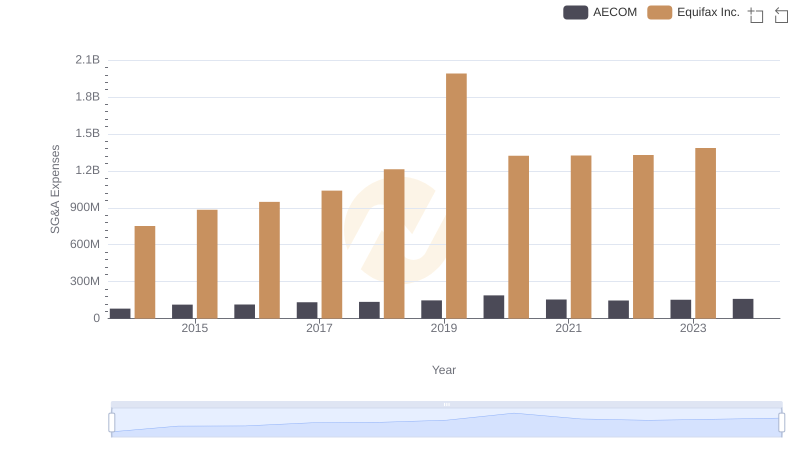
Equifax Inc. and AECOM: SG&A Spending Patterns Compared
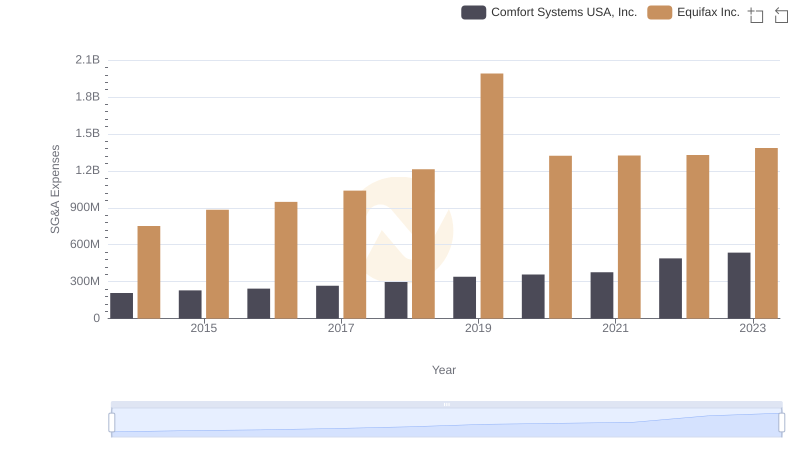
Equifax Inc. or Comfort Systems USA, Inc.: Who Manages SG&A Costs Better?
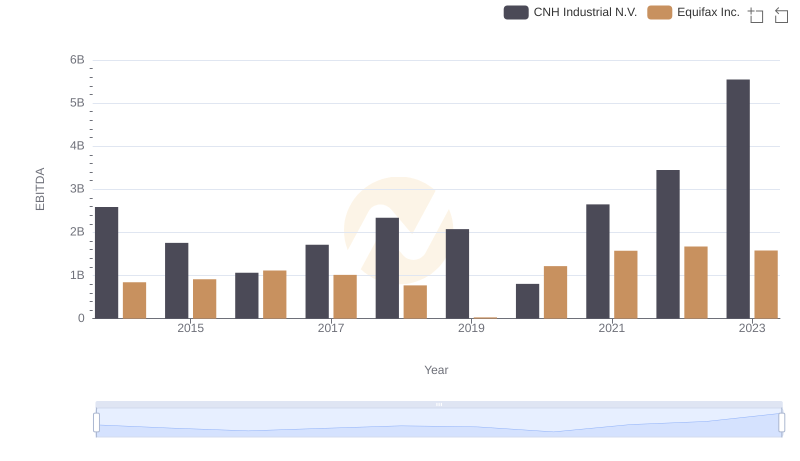
Comparative EBITDA Analysis: Equifax Inc. vs CNH Industrial N.V.
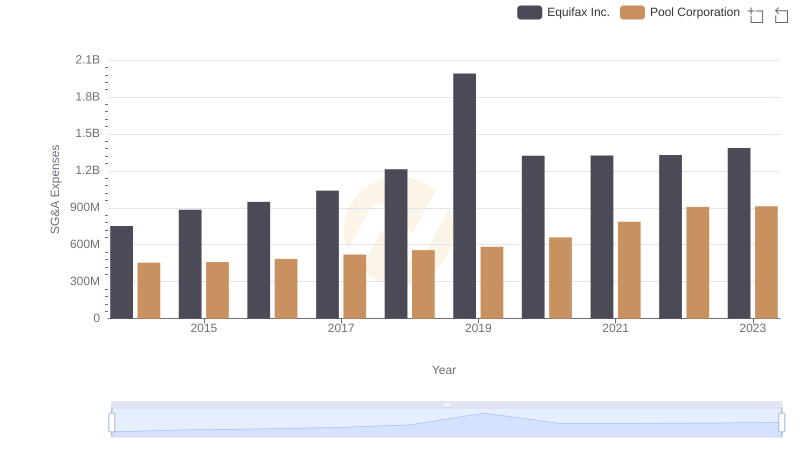
Comparing SG&A Expenses: Equifax Inc. vs Pool Corporation Trends and Insights
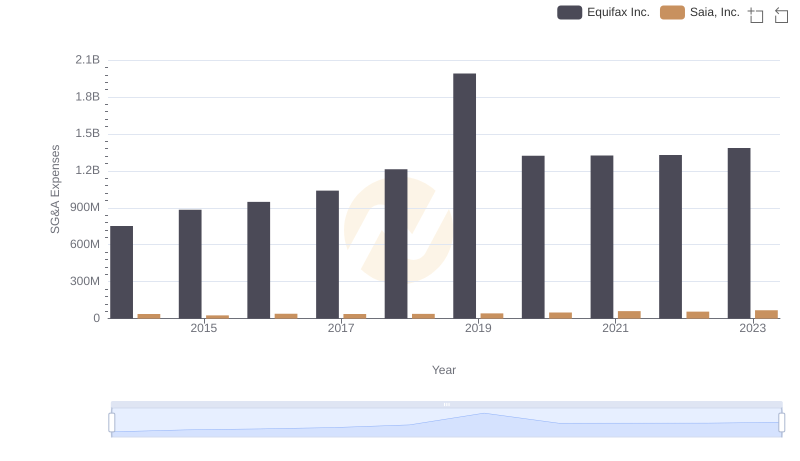
Operational Costs Compared: SG&A Analysis of Equifax Inc. and Saia, Inc.
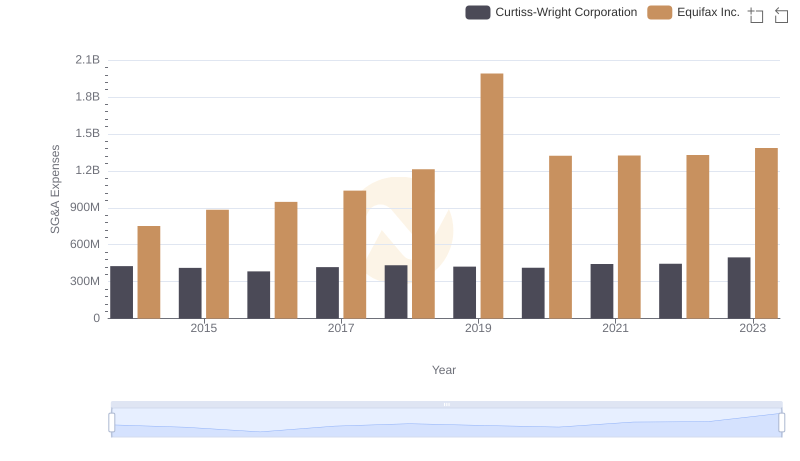
Equifax Inc. or Curtiss-Wright Corporation: Who Manages SG&A Costs Better?