| __timestamp | Block, Inc. | Cisco Systems, Inc. |
|---|---|---|
| Wednesday, January 1, 2014 | 624118000 | 19373000000 |
| Thursday, January 1, 2015 | 897088000 | 19480000000 |
| Friday, January 1, 2016 | 1132683000 | 18287000000 |
| Sunday, January 1, 2017 | 1374947000 | 17781000000 |
| Monday, January 1, 2018 | 1994477000 | 18724000000 |
| Tuesday, January 1, 2019 | 2823815000 | 19238000000 |
| Wednesday, January 1, 2020 | 6764169000 | 17618000000 |
| Friday, January 1, 2021 | 13241380000 | 17924000000 |
| Saturday, January 1, 2022 | 11539695000 | 19309000000 |
| Sunday, January 1, 2023 | 14410737000 | 21245000000 |
| Monday, January 1, 2024 | 18975000000 |
Unleashing insights
In the ever-evolving tech landscape, Cisco Systems, Inc. and Block, Inc. (formerly Square) have carved distinct niches. Over the past decade, their cost of revenue trends reveal intriguing insights into their operational strategies. Cisco, a stalwart in networking, consistently maintained a high cost of revenue, peaking at approximately $21 billion in 2023. This reflects its expansive infrastructure and global reach. In contrast, Block, a fintech innovator, showcased a dynamic growth trajectory. From a modest $624 million in 2014, Block's cost of revenue surged over 2,000% to nearly $14 billion by 2023, underscoring its rapid expansion and adaptation in the digital payments arena. Notably, 2024 data for Block is missing, hinting at potential shifts or strategic pivots. This comparison not only highlights their financial strategies but also offers a glimpse into the broader tech industry's evolution.
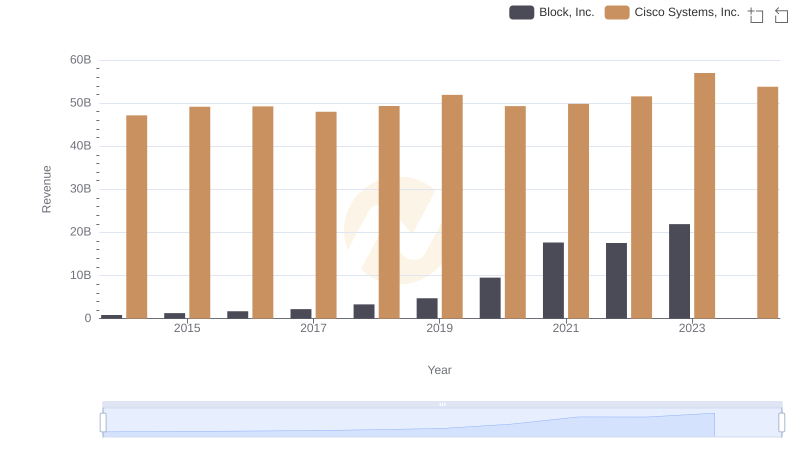
Revenue Insights: Cisco Systems, Inc. and Block, Inc. Performance Compared
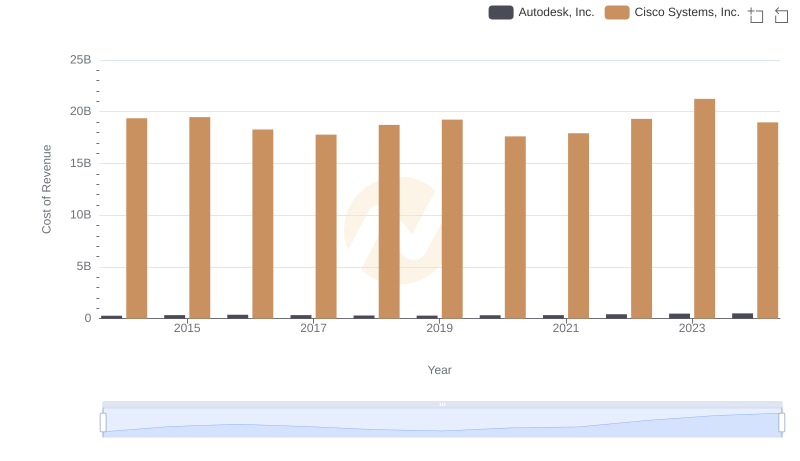
Cost Insights: Breaking Down Cisco Systems, Inc. and Autodesk, Inc.'s Expenses
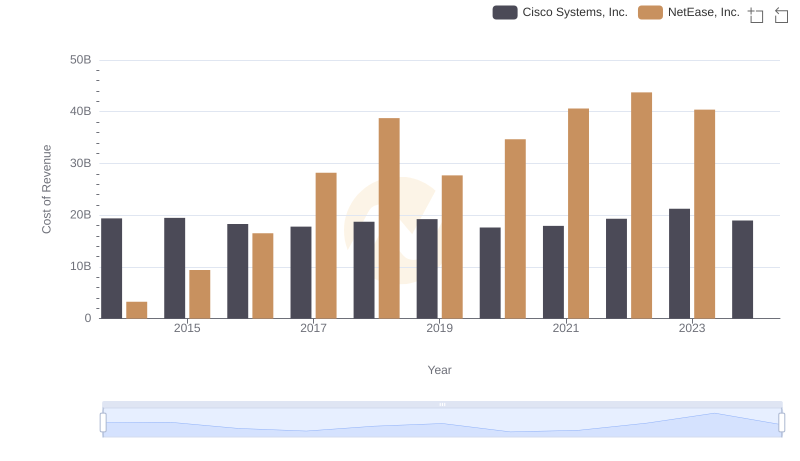
Cost of Revenue: Key Insights for Cisco Systems, Inc. and NetEase, Inc.
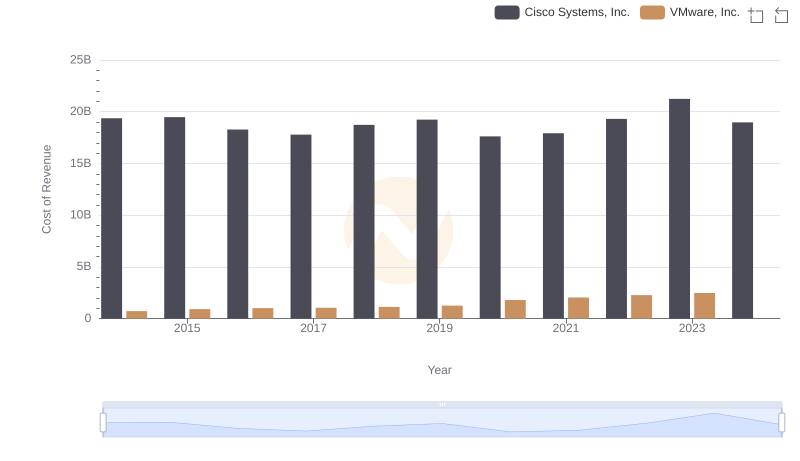
Analyzing Cost of Revenue: Cisco Systems, Inc. and VMware, Inc.
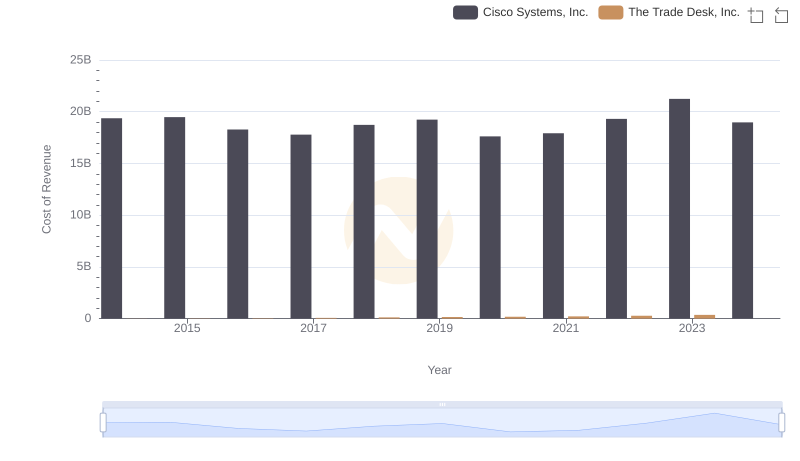
Cost of Revenue Trends: Cisco Systems, Inc. vs The Trade Desk, Inc.
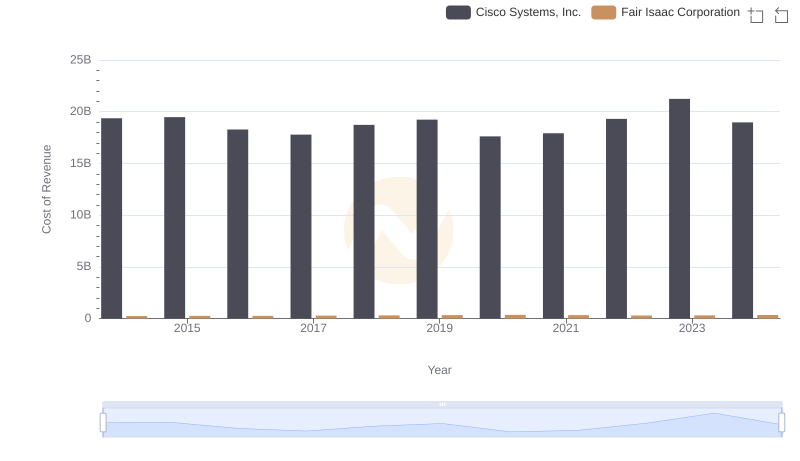
Cost Insights: Breaking Down Cisco Systems, Inc. and Fair Isaac Corporation's Expenses
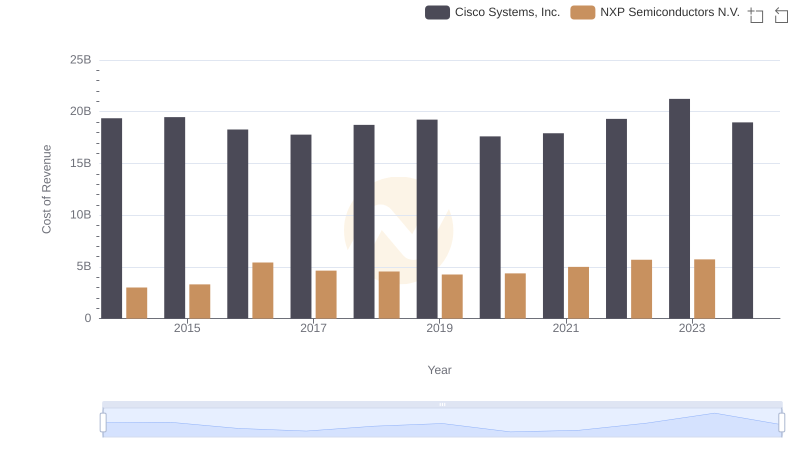
Analyzing Cost of Revenue: Cisco Systems, Inc. and NXP Semiconductors N.V.
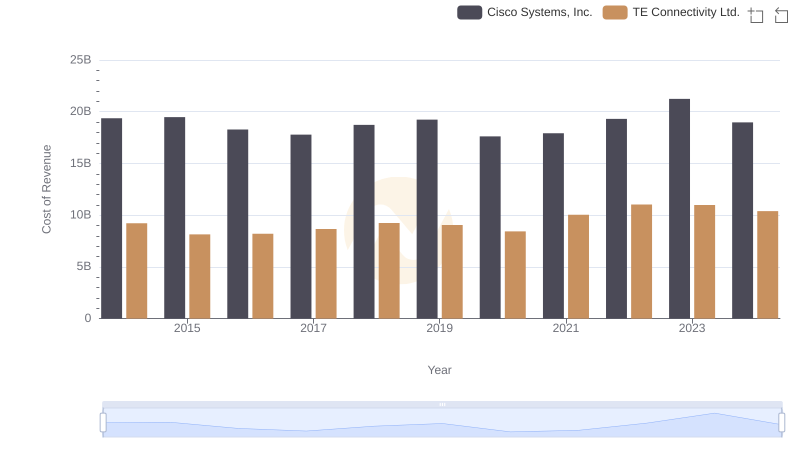
Cost of Revenue Trends: Cisco Systems, Inc. vs TE Connectivity Ltd.

Cost of Revenue Comparison: Cisco Systems, Inc. vs Fidelity National Information Services, Inc.
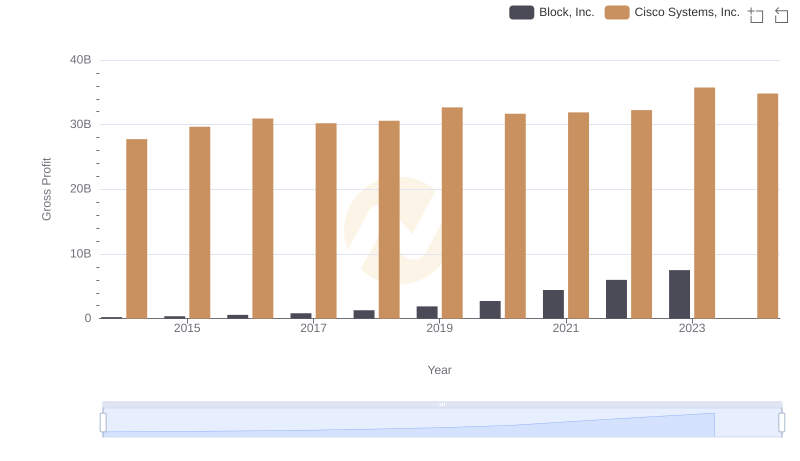
Gross Profit Comparison: Cisco Systems, Inc. and Block, Inc. Trends

Comparing Innovation Spending: Cisco Systems, Inc. and Block, Inc.
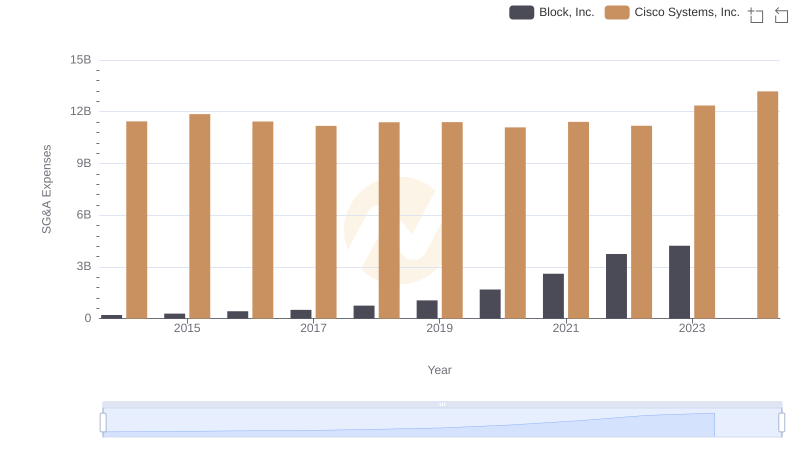
SG&A Efficiency Analysis: Comparing Cisco Systems, Inc. and Block, Inc.