| __timestamp | Cisco Systems, Inc. | NetEase, Inc. |
|---|---|---|
| Wednesday, January 1, 2014 | 19373000000 | 3261544000 |
| Thursday, January 1, 2015 | 19480000000 | 9399260000 |
| Friday, January 1, 2016 | 18287000000 | 16515032000 |
| Sunday, January 1, 2017 | 17781000000 | 28189326000 |
| Monday, January 1, 2018 | 18724000000 | 38752957000 |
| Tuesday, January 1, 2019 | 19238000000 | 27685845000 |
| Wednesday, January 1, 2020 | 17618000000 | 34683731000 |
| Friday, January 1, 2021 | 17924000000 | 40635225000 |
| Saturday, January 1, 2022 | 19309000000 | 43729683000 |
| Sunday, January 1, 2023 | 21245000000 | 40404765000 |
| Monday, January 1, 2024 | 18975000000 |
Unlocking the unknown
In the ever-evolving landscape of technology and internet services, understanding the cost of revenue is crucial for evaluating a company's financial health. Cisco Systems, Inc., a leader in networking hardware, and NetEase, Inc., a prominent Chinese internet technology company, offer intriguing insights into their financial trajectories from 2014 to 2023.
Cisco's cost of revenue has shown a relatively stable trend, with a slight dip in 2020, likely due to global economic disruptions. However, by 2023, Cisco's cost of revenue surged by approximately 10% compared to 2014, reflecting strategic investments and market expansion.
NetEase, on the other hand, experienced a dramatic increase, with its cost of revenue growing over 1,200% from 2014 to 2023. This growth underscores NetEase's aggressive expansion in the gaming and e-commerce sectors. Notably, data for 2024 is missing, indicating potential future shifts.
These insights highlight the dynamic nature of the tech industry and the strategic maneuvers companies must undertake to thrive.
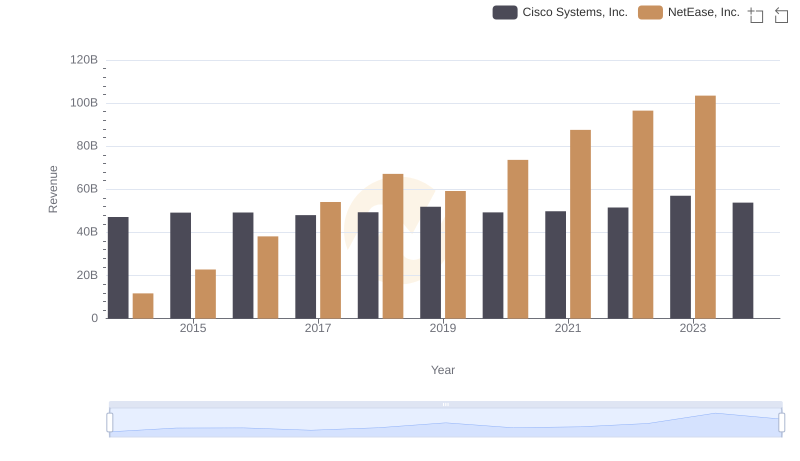
Annual Revenue Comparison: Cisco Systems, Inc. vs NetEase, Inc.
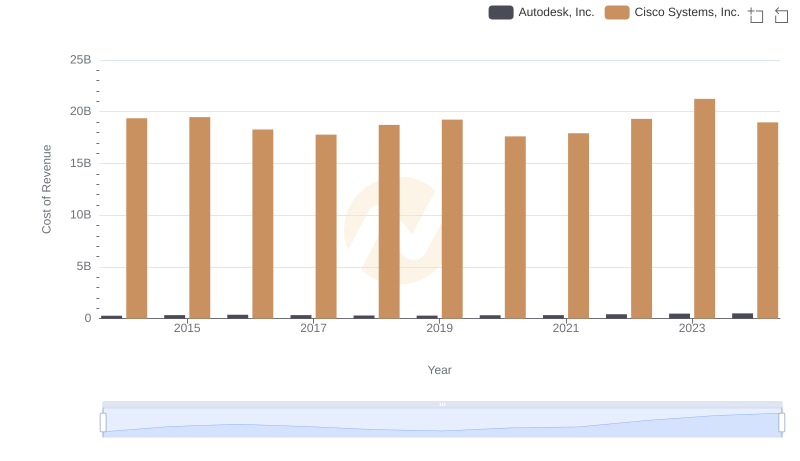
Cost Insights: Breaking Down Cisco Systems, Inc. and Autodesk, Inc.'s Expenses

Cost of Revenue Comparison: Cisco Systems, Inc. vs Block, Inc.
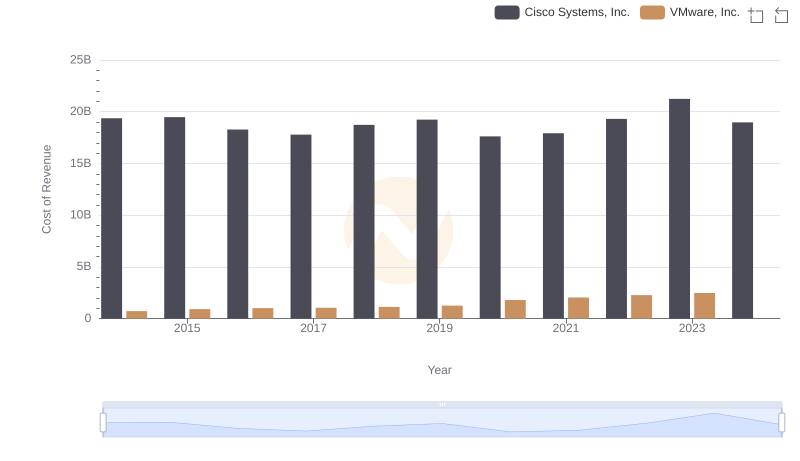
Analyzing Cost of Revenue: Cisco Systems, Inc. and VMware, Inc.
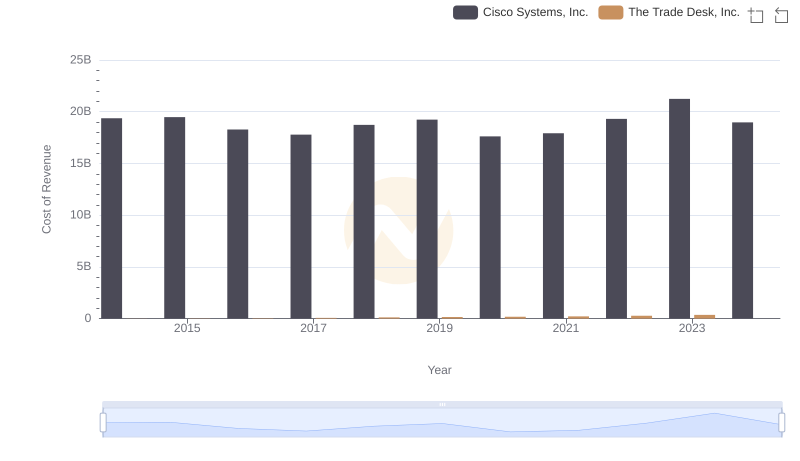
Cost of Revenue Trends: Cisco Systems, Inc. vs The Trade Desk, Inc.
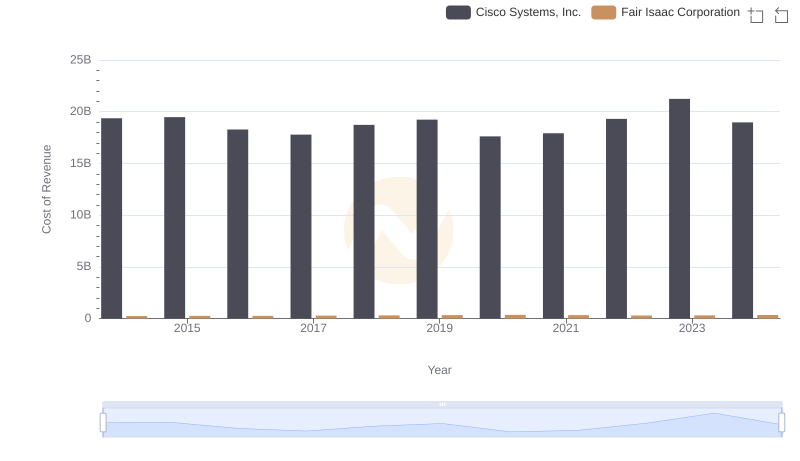
Cost Insights: Breaking Down Cisco Systems, Inc. and Fair Isaac Corporation's Expenses
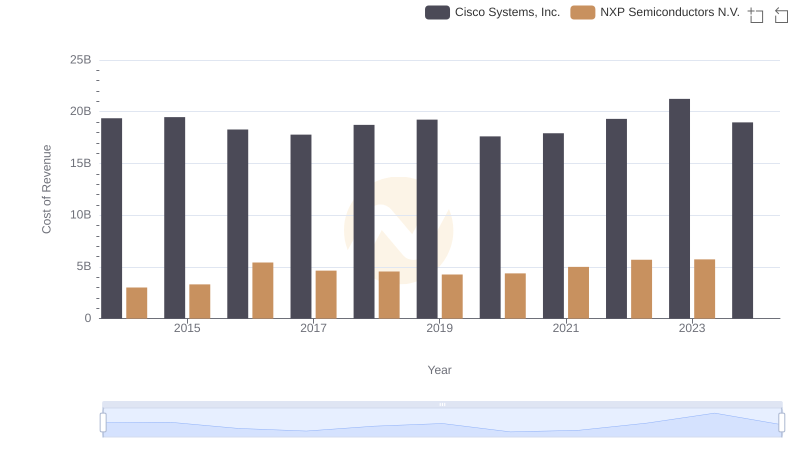
Analyzing Cost of Revenue: Cisco Systems, Inc. and NXP Semiconductors N.V.
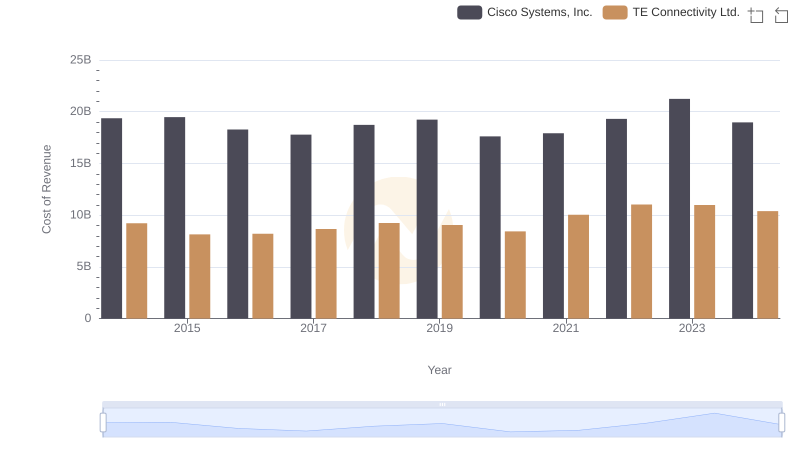
Cost of Revenue Trends: Cisco Systems, Inc. vs TE Connectivity Ltd.
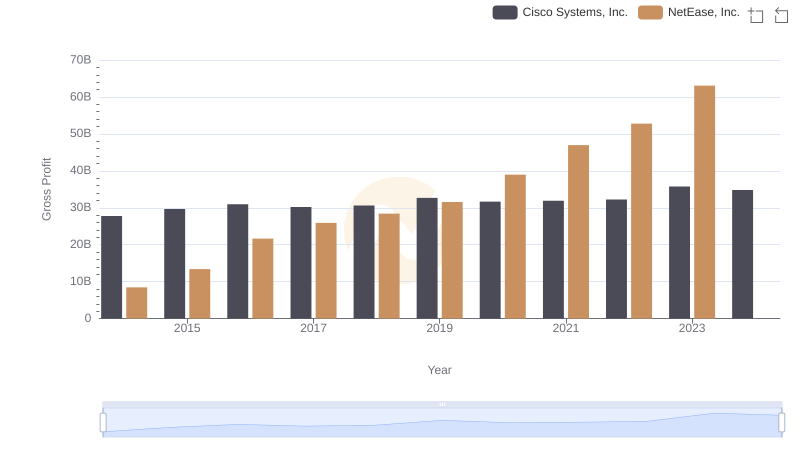
Gross Profit Comparison: Cisco Systems, Inc. and NetEase, Inc. Trends
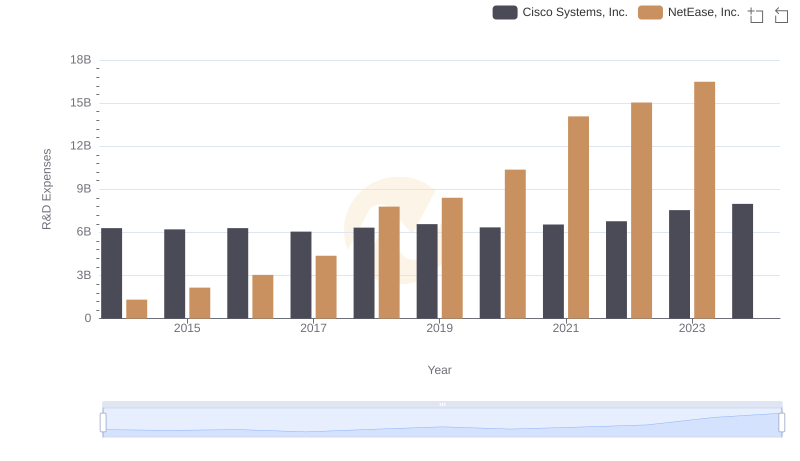
Research and Development: Comparing Key Metrics for Cisco Systems, Inc. and NetEase, Inc.
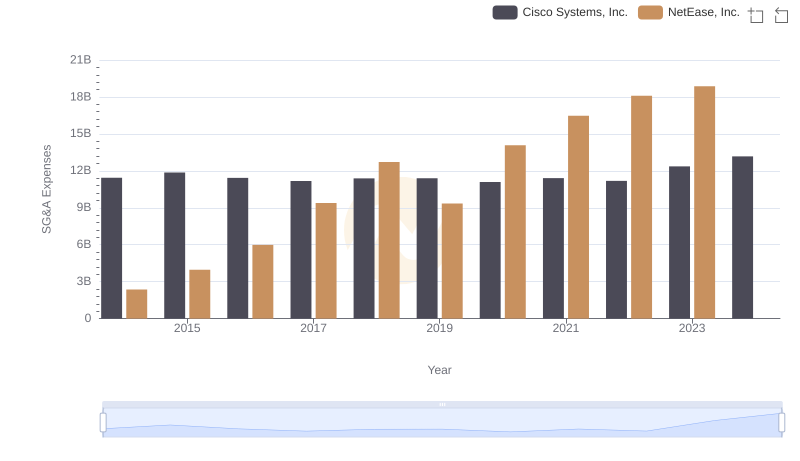
Selling, General, and Administrative Costs: Cisco Systems, Inc. vs NetEase, Inc.
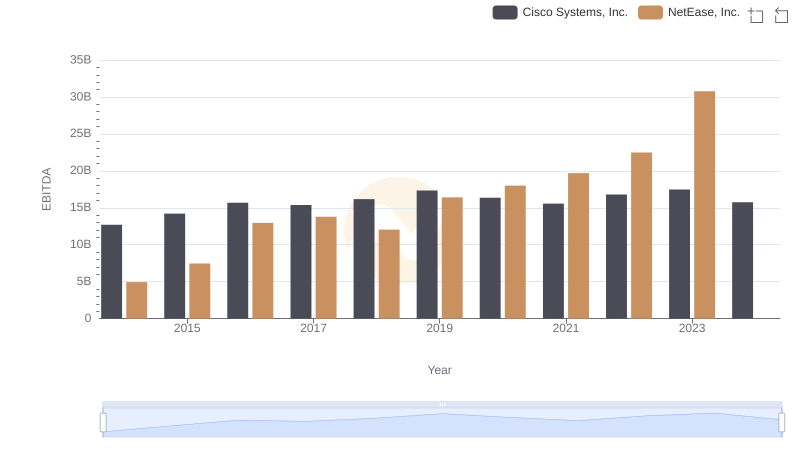
Comparative EBITDA Analysis: Cisco Systems, Inc. vs NetEase, Inc.