| __timestamp | Cisco Systems, Inc. | TE Connectivity Ltd. |
|---|---|---|
| Wednesday, January 1, 2014 | 19373000000 | 9220000000 |
| Thursday, January 1, 2015 | 19480000000 | 8146000000 |
| Friday, January 1, 2016 | 18287000000 | 8205000000 |
| Sunday, January 1, 2017 | 17781000000 | 8663000000 |
| Monday, January 1, 2018 | 18724000000 | 9243000000 |
| Tuesday, January 1, 2019 | 19238000000 | 9054000000 |
| Wednesday, January 1, 2020 | 17618000000 | 8437000000 |
| Friday, January 1, 2021 | 17924000000 | 10036000000 |
| Saturday, January 1, 2022 | 19309000000 | 11037000000 |
| Sunday, January 1, 2023 | 21245000000 | 10979000000 |
| Monday, January 1, 2024 | 18975000000 | 10389000000 |
Unveiling the hidden dimensions of data
In the ever-evolving landscape of technology and connectivity, Cisco Systems, Inc. and TE Connectivity Ltd. have been pivotal players. Over the past decade, from 2014 to 2024, these industry titans have showcased intriguing trends in their cost of revenue. Cisco Systems, Inc. has experienced a modest fluctuation, with a peak in 2023, where costs rose by approximately 10% compared to 2014. Meanwhile, TE Connectivity Ltd. has seen a more dynamic shift, with a notable 20% increase in 2023 compared to its 2014 figures. This divergence highlights the distinct strategic approaches of these companies in managing their operational expenses. As we look towards 2024, Cisco's costs appear to stabilize, while TE Connectivity's costs show a slight decline, suggesting a potential shift in market dynamics. These trends offer valuable insights into the financial strategies and market positioning of these two influential corporations.

Breaking Down Revenue Trends: Cisco Systems, Inc. vs TE Connectivity Ltd.
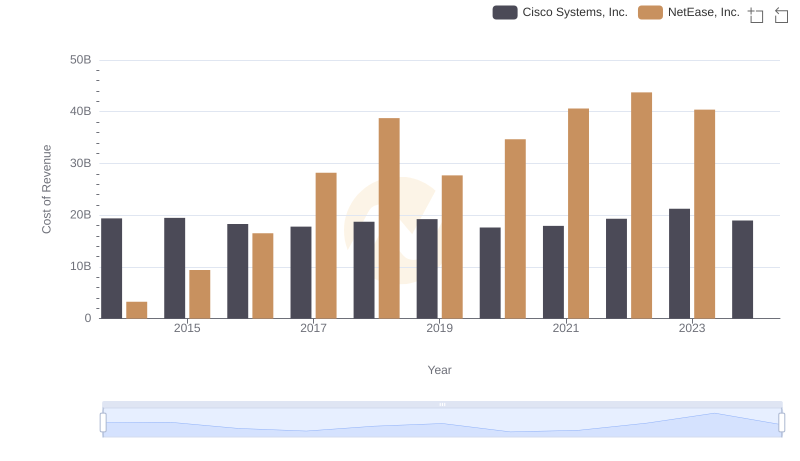
Cost of Revenue: Key Insights for Cisco Systems, Inc. and NetEase, Inc.

Cost of Revenue Comparison: Cisco Systems, Inc. vs Block, Inc.
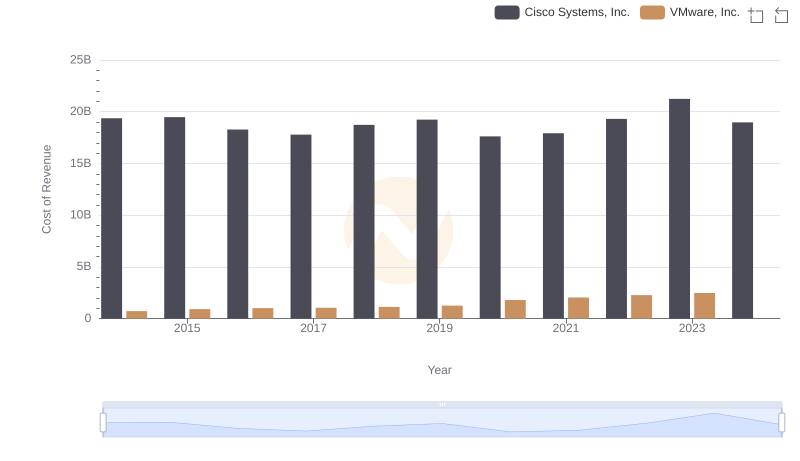
Analyzing Cost of Revenue: Cisco Systems, Inc. and VMware, Inc.
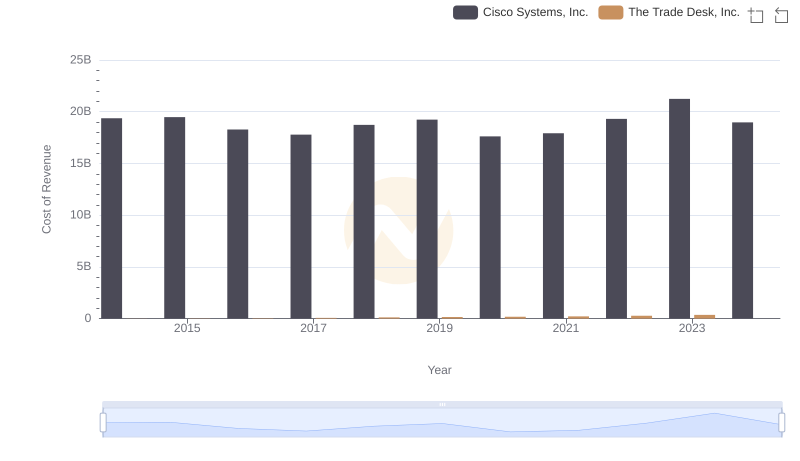
Cost of Revenue Trends: Cisco Systems, Inc. vs The Trade Desk, Inc.
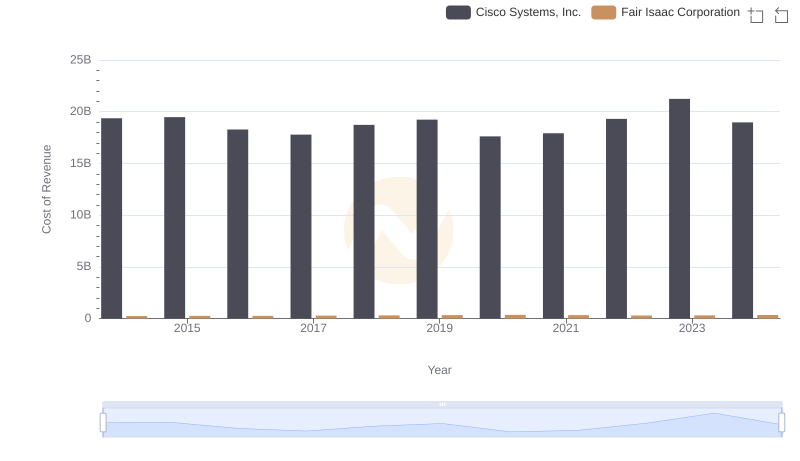
Cost Insights: Breaking Down Cisco Systems, Inc. and Fair Isaac Corporation's Expenses
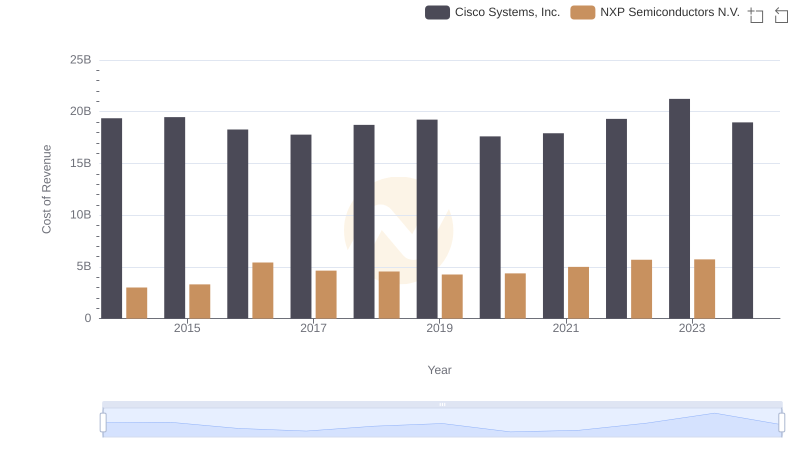
Analyzing Cost of Revenue: Cisco Systems, Inc. and NXP Semiconductors N.V.

Cost of Revenue Comparison: Cisco Systems, Inc. vs Fidelity National Information Services, Inc.
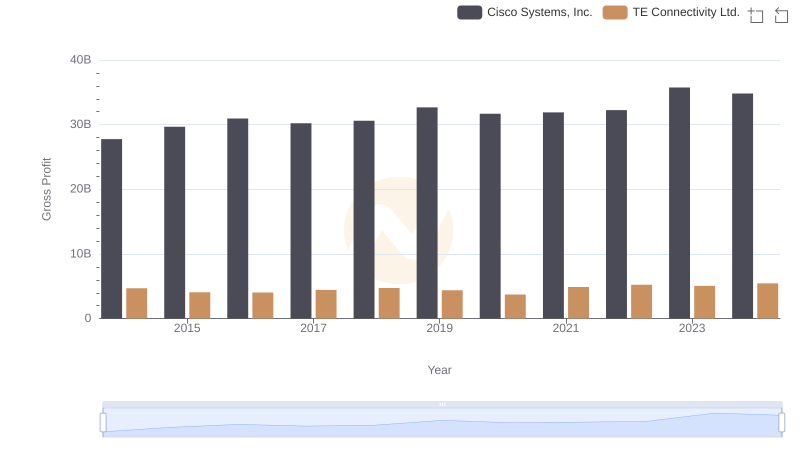
Who Generates Higher Gross Profit? Cisco Systems, Inc. or TE Connectivity Ltd.
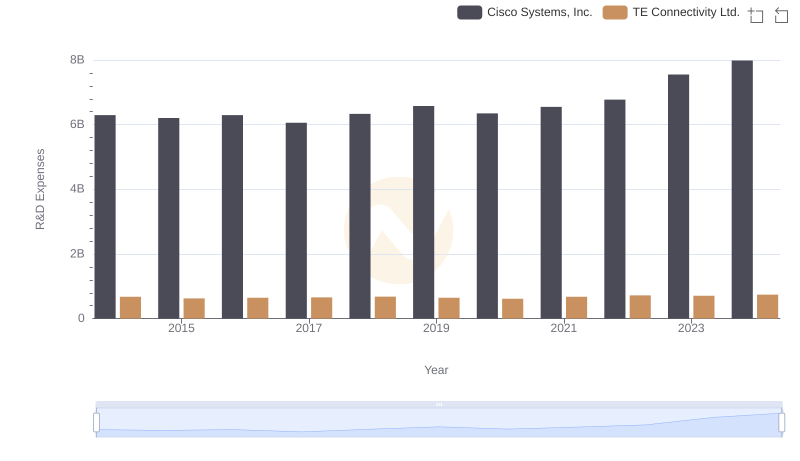
Cisco Systems, Inc. vs TE Connectivity Ltd.: Strategic Focus on R&D Spending
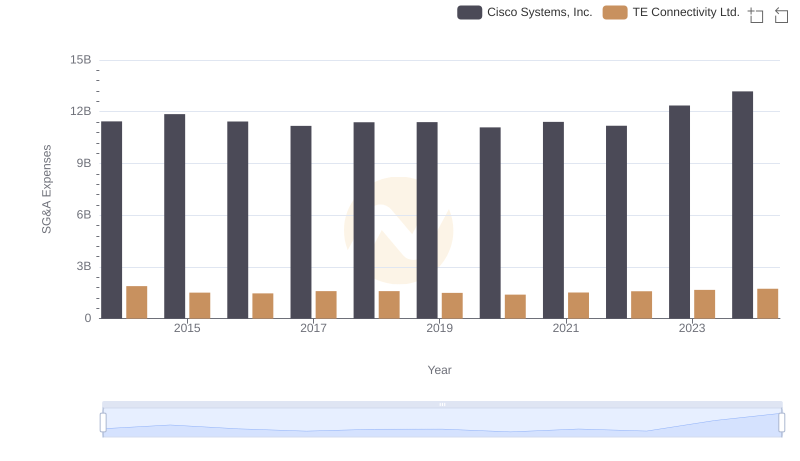
Who Optimizes SG&A Costs Better? Cisco Systems, Inc. or TE Connectivity Ltd.
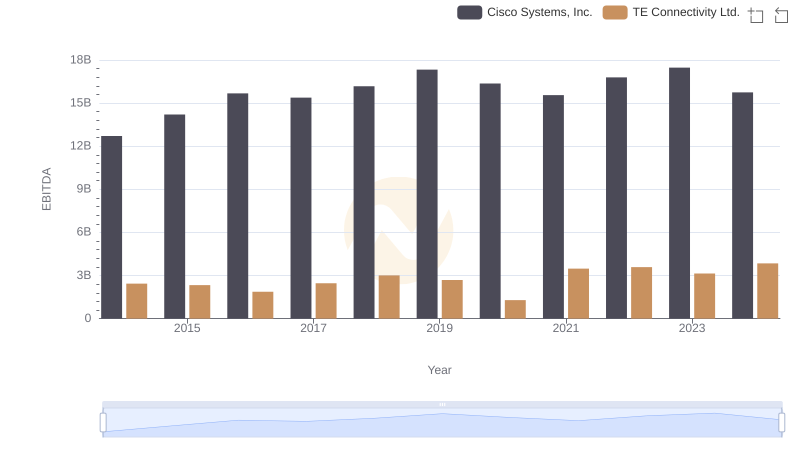
Professional EBITDA Benchmarking: Cisco Systems, Inc. vs TE Connectivity Ltd.