| __timestamp | Cisco Systems, Inc. | NXP Semiconductors N.V. |
|---|---|---|
| Wednesday, January 1, 2014 | 19373000000 | 3007000000 |
| Thursday, January 1, 2015 | 19480000000 | 3314000000 |
| Friday, January 1, 2016 | 18287000000 | 5429000000 |
| Sunday, January 1, 2017 | 17781000000 | 4637000000 |
| Monday, January 1, 2018 | 18724000000 | 4556000000 |
| Tuesday, January 1, 2019 | 19238000000 | 4259000000 |
| Wednesday, January 1, 2020 | 17618000000 | 4377000000 |
| Friday, January 1, 2021 | 17924000000 | 4996000000 |
| Saturday, January 1, 2022 | 19309000000 | 5688000000 |
| Sunday, January 1, 2023 | 21245000000 | 5723000000 |
| Monday, January 1, 2024 | 18975000000 |
Unveiling the hidden dimensions of data
In the ever-evolving tech industry, understanding the cost of revenue is crucial for evaluating a company's financial health. Cisco Systems, Inc. and NXP Semiconductors N.V., two giants in the field, have shown distinct trends over the past decade. From 2014 to 2023, Cisco's cost of revenue fluctuated, peaking in 2023 with a 10% increase from 2014. Meanwhile, NXP Semiconductors experienced a remarkable 90% surge in cost of revenue, reflecting its aggressive growth strategy.
The data for 2024 is incomplete, highlighting the need for continuous monitoring to make informed investment decisions.
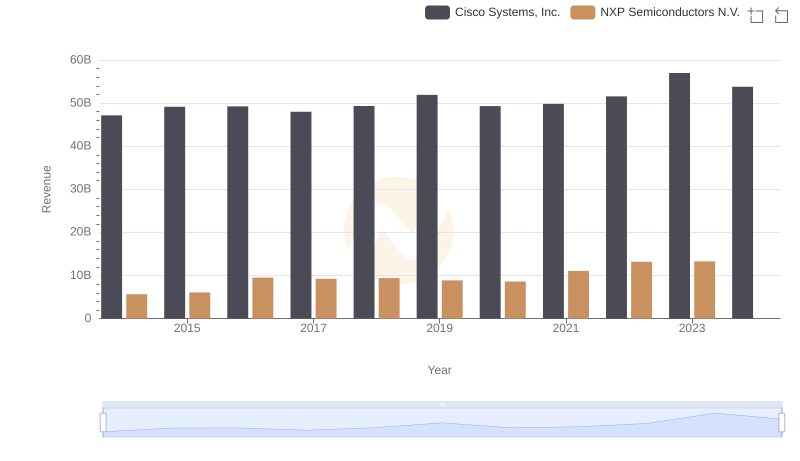
Cisco Systems, Inc. and NXP Semiconductors N.V.: A Comprehensive Revenue Analysis
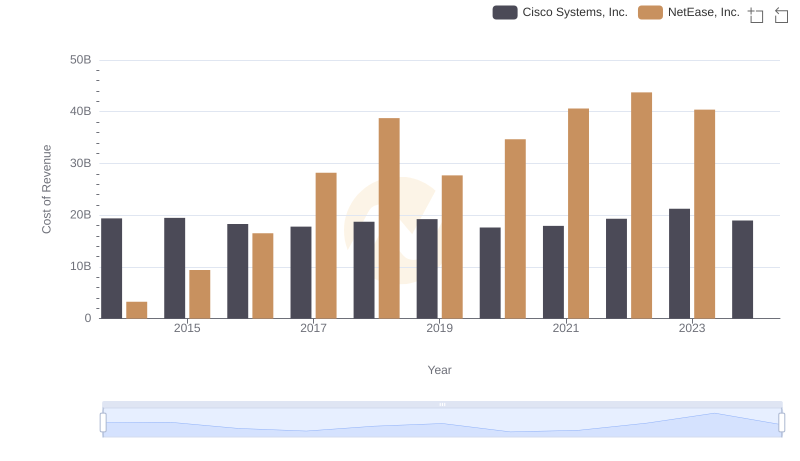
Cost of Revenue: Key Insights for Cisco Systems, Inc. and NetEase, Inc.

Cost of Revenue Comparison: Cisco Systems, Inc. vs Block, Inc.
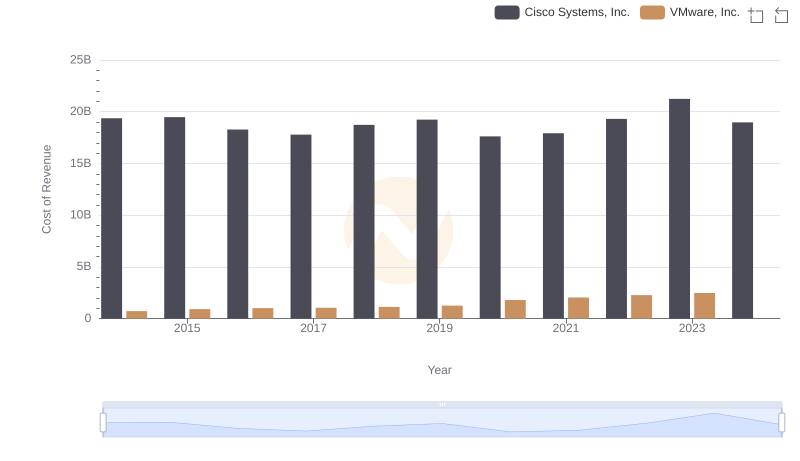
Analyzing Cost of Revenue: Cisco Systems, Inc. and VMware, Inc.
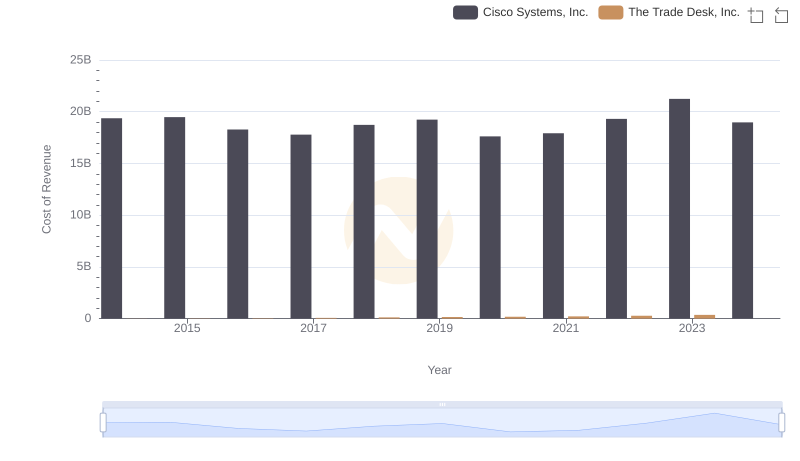
Cost of Revenue Trends: Cisco Systems, Inc. vs The Trade Desk, Inc.
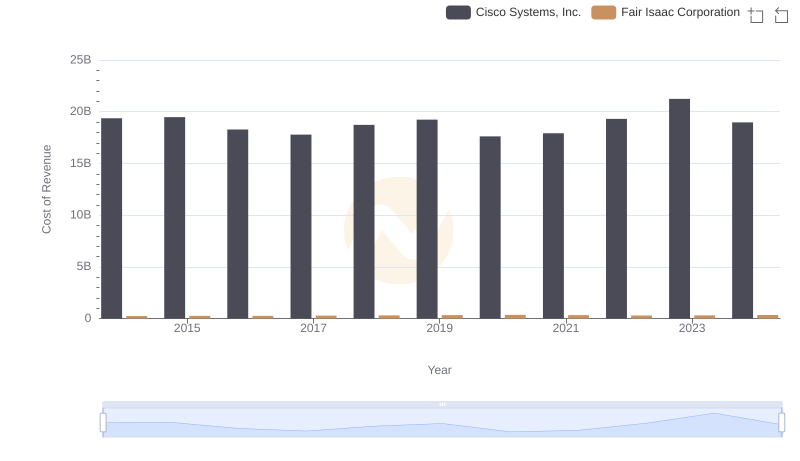
Cost Insights: Breaking Down Cisco Systems, Inc. and Fair Isaac Corporation's Expenses
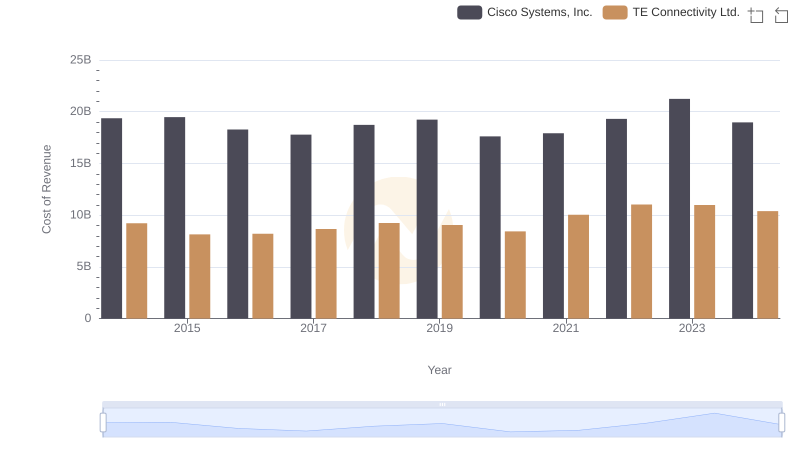
Cost of Revenue Trends: Cisco Systems, Inc. vs TE Connectivity Ltd.

Cost of Revenue Comparison: Cisco Systems, Inc. vs Fidelity National Information Services, Inc.
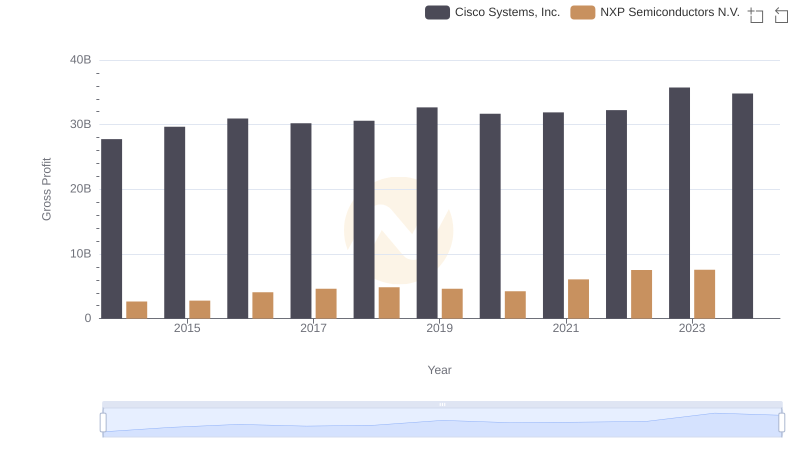
Key Insights on Gross Profit: Cisco Systems, Inc. vs NXP Semiconductors N.V.
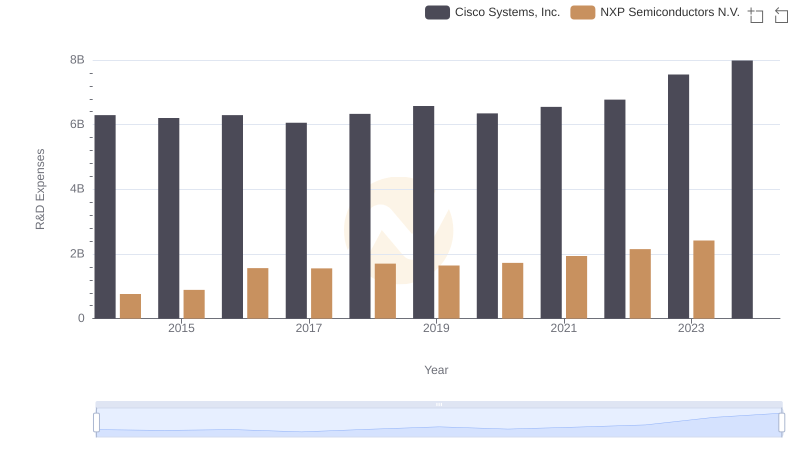
Research and Development: Comparing Key Metrics for Cisco Systems, Inc. and NXP Semiconductors N.V.
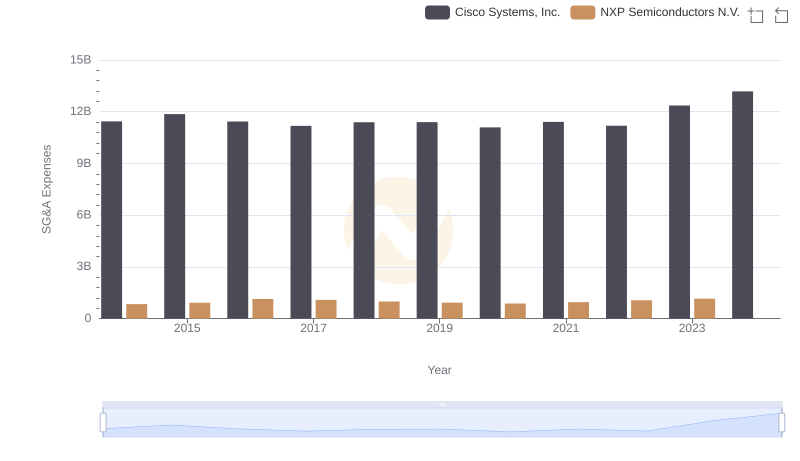
Cisco Systems, Inc. or NXP Semiconductors N.V.: Who Manages SG&A Costs Better?
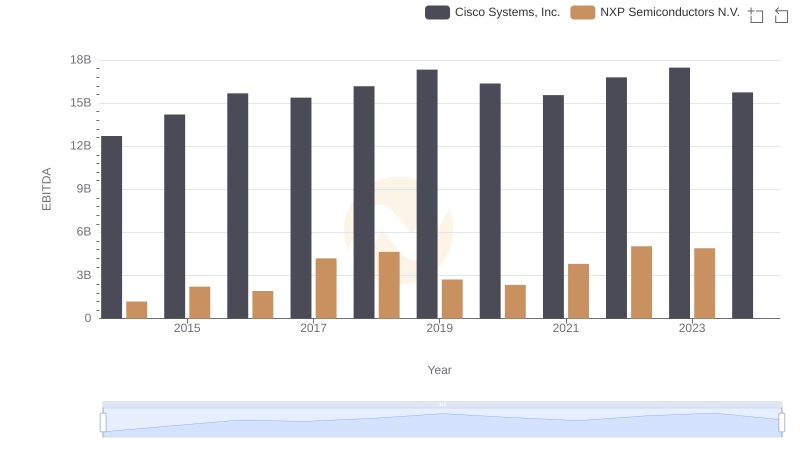
Comparative EBITDA Analysis: Cisco Systems, Inc. vs NXP Semiconductors N.V.