| __timestamp | Cisco Systems, Inc. | VMware, Inc. |
|---|---|---|
| Wednesday, January 1, 2014 | 19373000000 | 730000000 |
| Thursday, January 1, 2015 | 19480000000 | 917000000 |
| Friday, January 1, 2016 | 18287000000 | 1018000000 |
| Sunday, January 1, 2017 | 17781000000 | 1053000000 |
| Monday, January 1, 2018 | 18724000000 | 1141000000 |
| Tuesday, January 1, 2019 | 19238000000 | 1258000000 |
| Wednesday, January 1, 2020 | 17618000000 | 1799000000 |
| Friday, January 1, 2021 | 17924000000 | 2043000000 |
| Saturday, January 1, 2022 | 19309000000 | 2271000000 |
| Sunday, January 1, 2023 | 21245000000 | 2482000000 |
| Monday, January 1, 2024 | 18975000000 |
Unveiling the hidden dimensions of data
In the ever-evolving tech industry, understanding the cost of revenue is crucial for evaluating a company's financial health. Cisco Systems, Inc. and VMware, Inc., two giants in the field, have shown distinct trends over the past decade. From 2014 to 2023, Cisco's cost of revenue has fluctuated, peaking in 2023 with a 10% increase from its 2014 figures. Meanwhile, VMware has experienced a remarkable growth trajectory, with its cost of revenue surging by over 240% during the same period. This stark contrast highlights VMware's aggressive expansion strategy compared to Cisco's more stable approach. Notably, data for 2024 is incomplete, indicating potential shifts in the coming year. As these companies continue to innovate, monitoring their cost structures will provide valuable insights into their strategic directions and market positions.
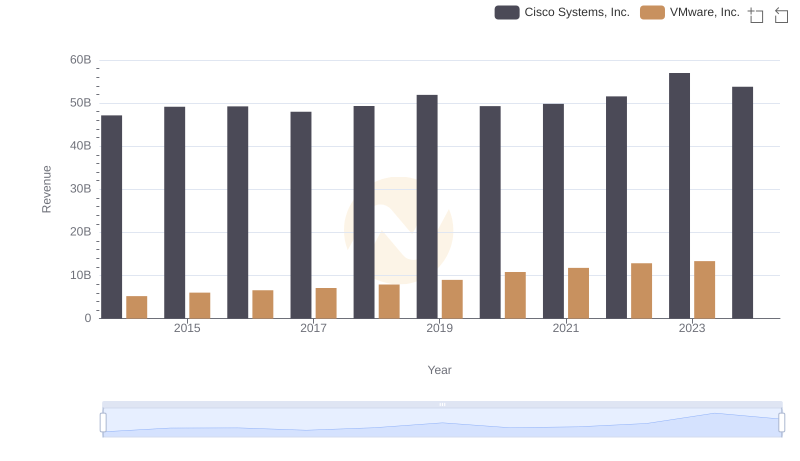
Annual Revenue Comparison: Cisco Systems, Inc. vs VMware, Inc.
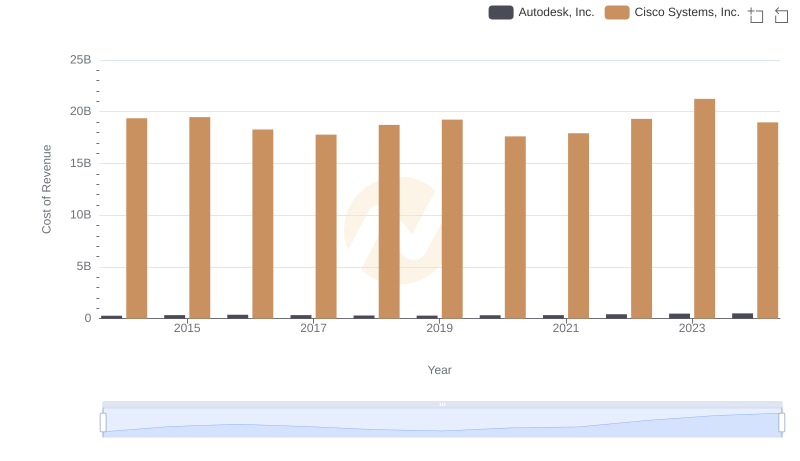
Cost Insights: Breaking Down Cisco Systems, Inc. and Autodesk, Inc.'s Expenses
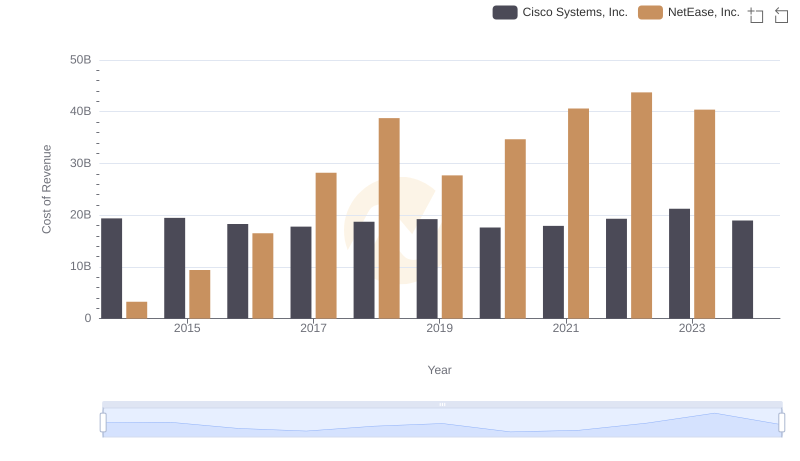
Cost of Revenue: Key Insights for Cisco Systems, Inc. and NetEase, Inc.

Cost of Revenue Comparison: Cisco Systems, Inc. vs Block, Inc.
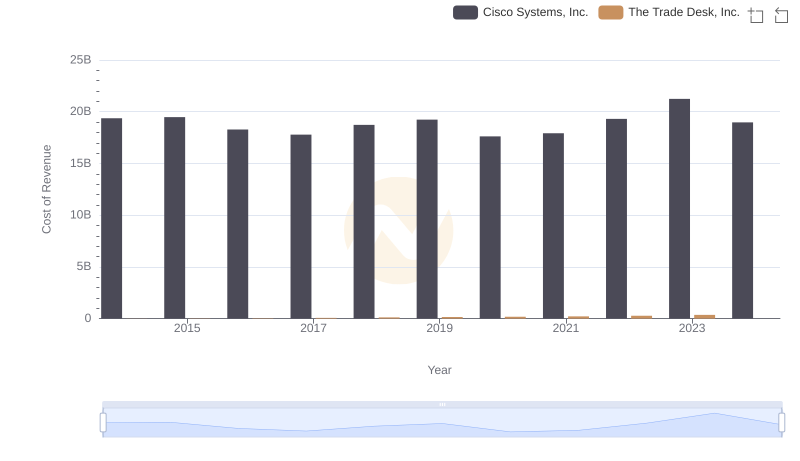
Cost of Revenue Trends: Cisco Systems, Inc. vs The Trade Desk, Inc.
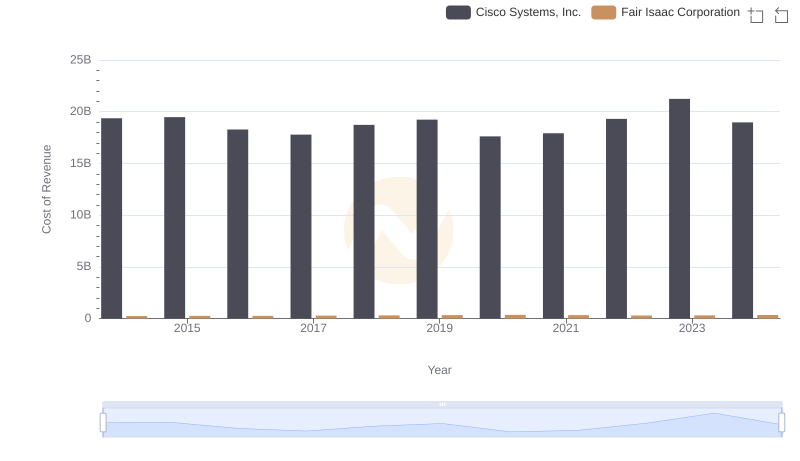
Cost Insights: Breaking Down Cisco Systems, Inc. and Fair Isaac Corporation's Expenses
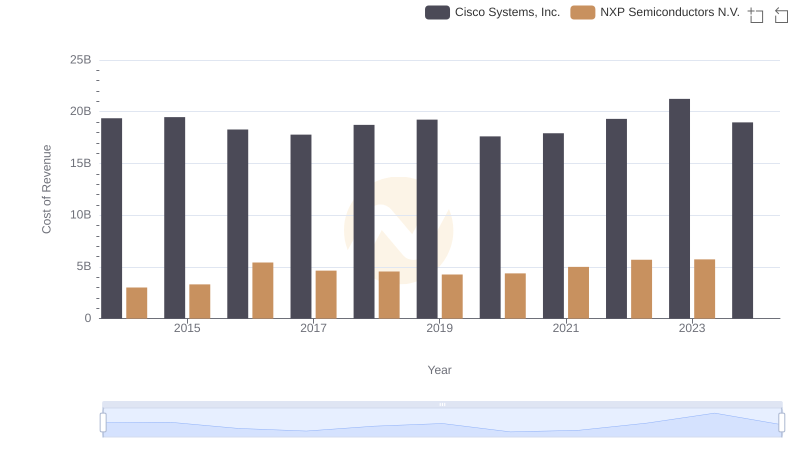
Analyzing Cost of Revenue: Cisco Systems, Inc. and NXP Semiconductors N.V.
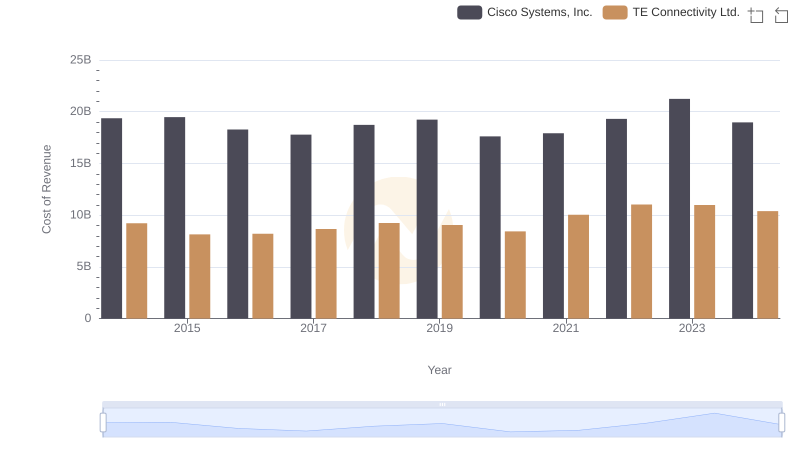
Cost of Revenue Trends: Cisco Systems, Inc. vs TE Connectivity Ltd.
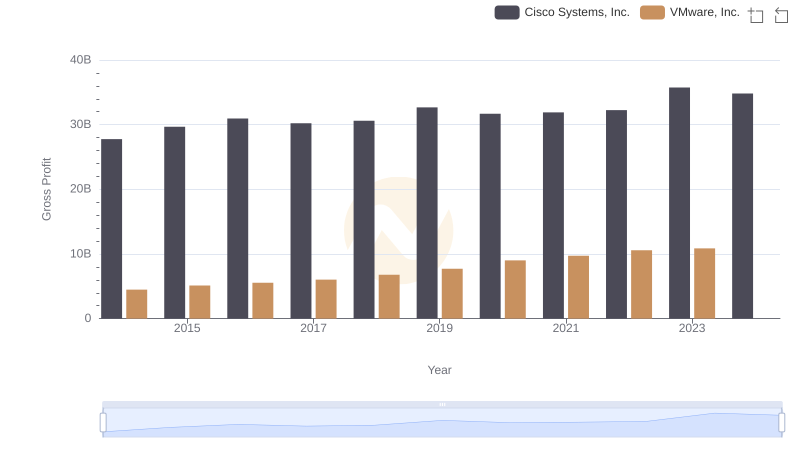
Cisco Systems, Inc. vs VMware, Inc.: A Gross Profit Performance Breakdown
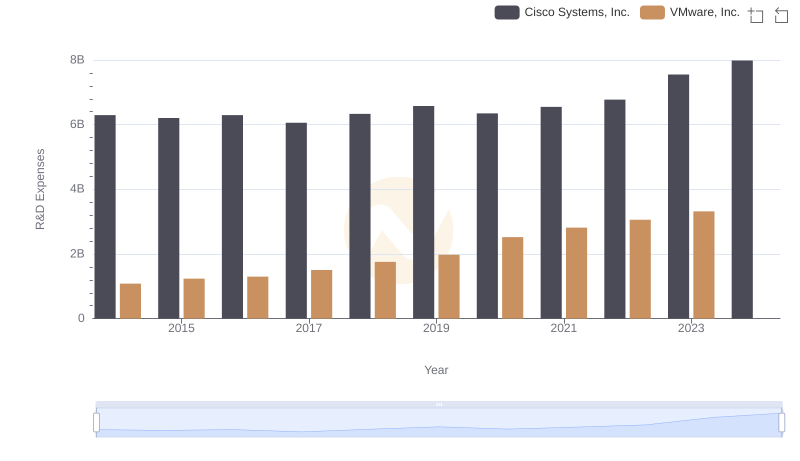
Cisco Systems, Inc. or VMware, Inc.: Who Invests More in Innovation?
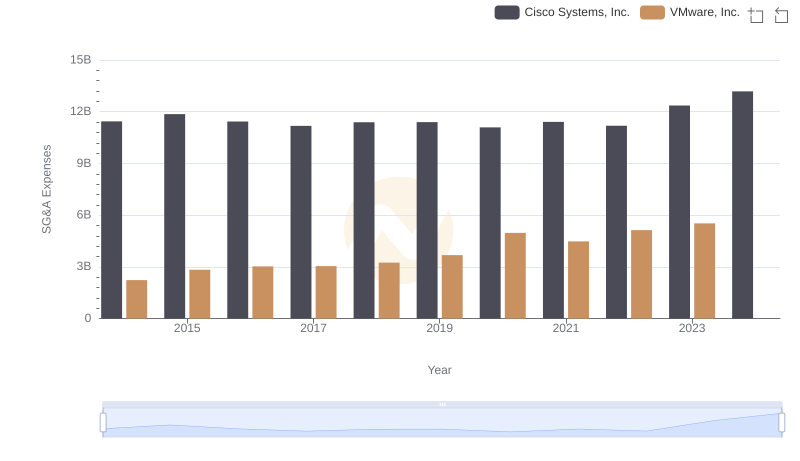
Cost Management Insights: SG&A Expenses for Cisco Systems, Inc. and VMware, Inc.
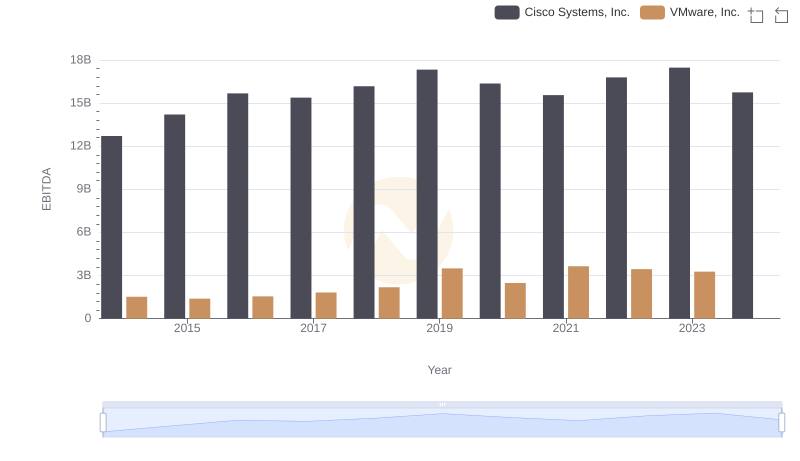
Cisco Systems, Inc. and VMware, Inc.: A Detailed Examination of EBITDA Performance