| __timestamp | American Airlines Group Inc. | Axon Enterprise, Inc. |
|---|---|---|
| Wednesday, January 1, 2014 | 31939000000 | 62977000 |
| Thursday, January 1, 2015 | 27967000000 | 69245000 |
| Friday, January 1, 2016 | 28339000000 | 97709000 |
| Sunday, January 1, 2017 | 31154000000 | 136710000 |
| Monday, January 1, 2018 | 34490000000 | 161485000 |
| Tuesday, January 1, 2019 | 35379000000 | 223574000 |
| Wednesday, January 1, 2020 | 24933000000 | 264672000 |
| Friday, January 1, 2021 | 29855000000 | 322471000 |
| Saturday, January 1, 2022 | 39934000000 | 461297000 |
| Sunday, January 1, 2023 | 40978000000 | 608009000 |
Data in motion
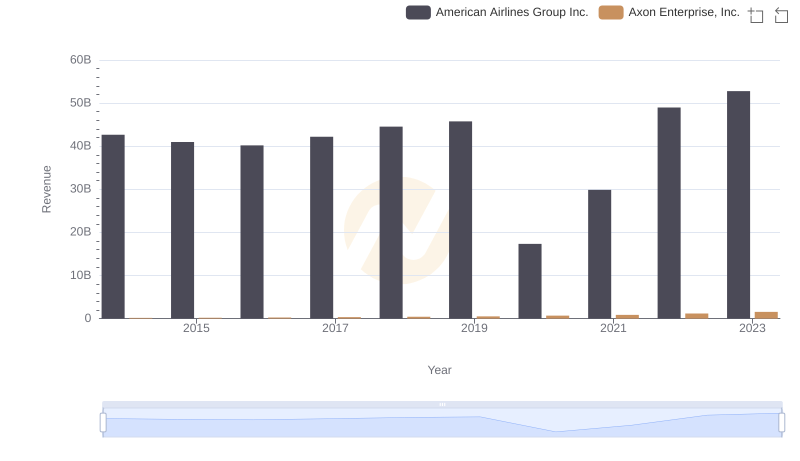
In the ever-evolving landscape of corporate expenses, understanding the cost dynamics of different industries provides valuable insights. This analysis delves into the cost of revenue trends for Axon Enterprise, Inc., a leader in public safety technology, and American Airlines Group Inc., a major player in the aviation sector, from 2014 to 2023.
American Airlines' cost of revenue has shown a steady increase, peaking at approximately $41 billion in 2023, a 28% rise from 2014. This reflects the airline industry's challenges, including fluctuating fuel prices and operational costs. In contrast, Axon Enterprise's cost of revenue, though significantly smaller, surged by nearly 866% over the same period, reaching around $608 million in 2023. This growth underscores the expanding demand for Axon's innovative safety solutions.
These contrasting trajectories highlight the diverse financial landscapes of technology and aviation, offering a fascinating glimpse into their operational strategies.
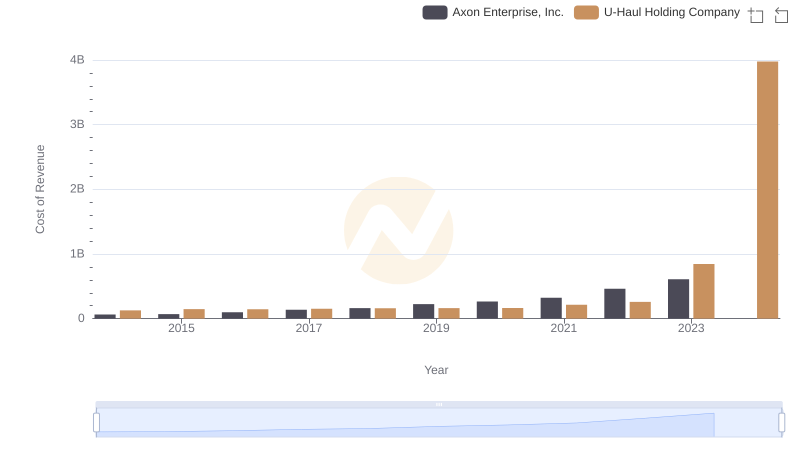
Cost Insights: Breaking Down Axon Enterprise, Inc. and U-Haul Holding Company's Expenses
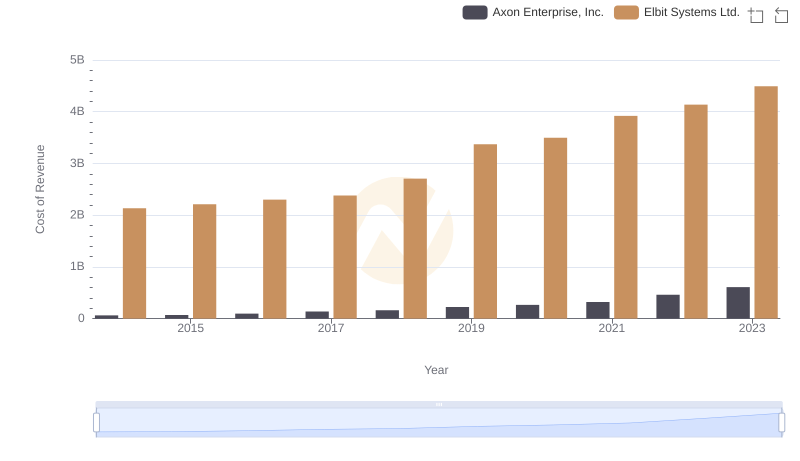
Analyzing Cost of Revenue: Axon Enterprise, Inc. and Elbit Systems Ltd.
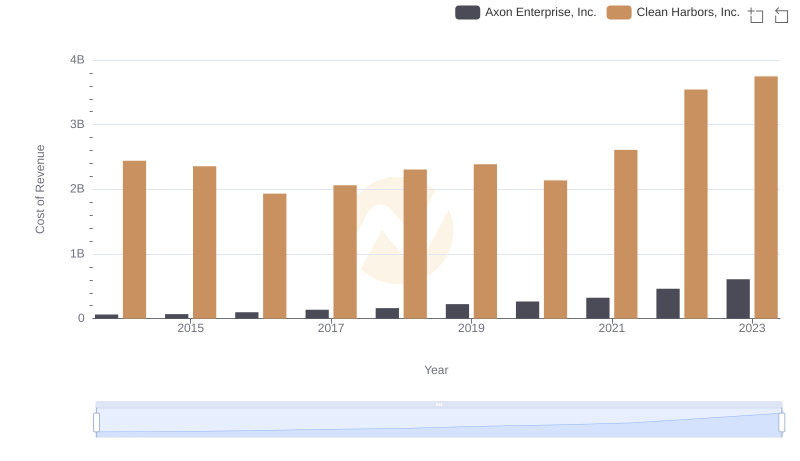
Analyzing Cost of Revenue: Axon Enterprise, Inc. and Clean Harbors, Inc.
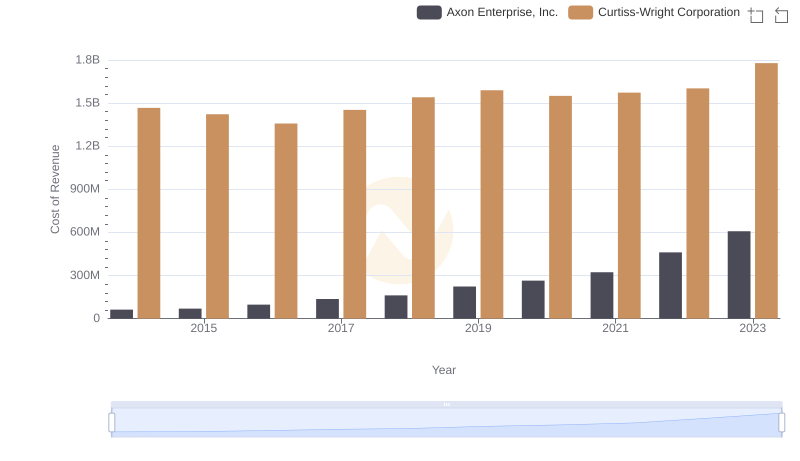
Cost of Revenue Trends: Axon Enterprise, Inc. vs Curtiss-Wright Corporation
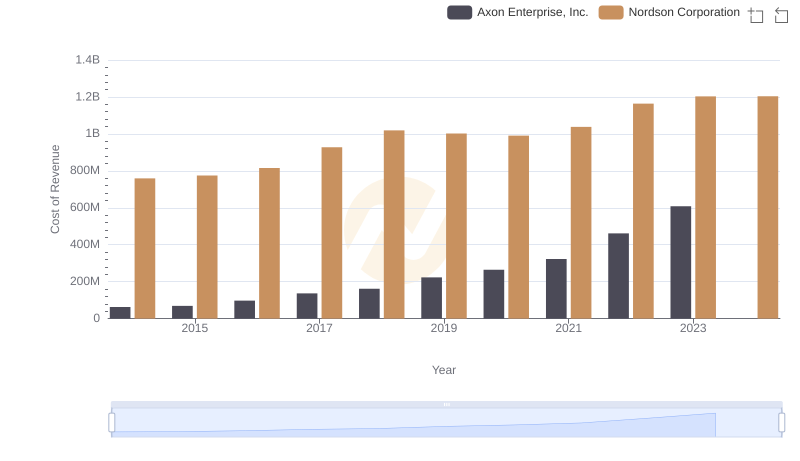
Cost of Revenue Trends: Axon Enterprise, Inc. vs Nordson Corporation
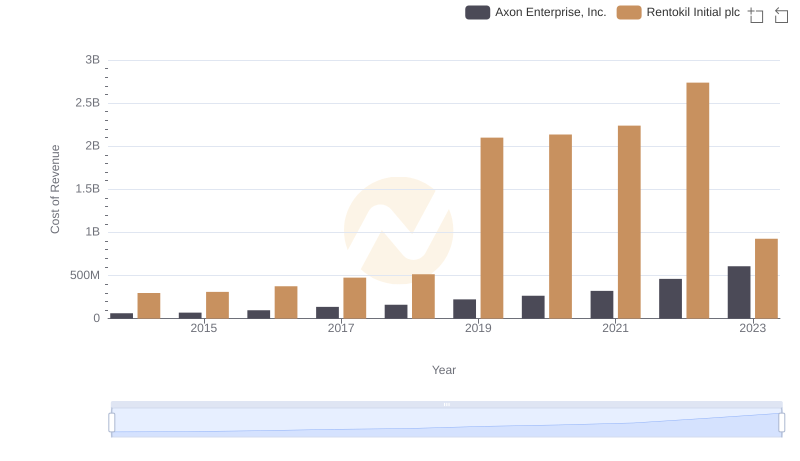
Axon Enterprise, Inc. vs Rentokil Initial plc: Efficiency in Cost of Revenue Explored
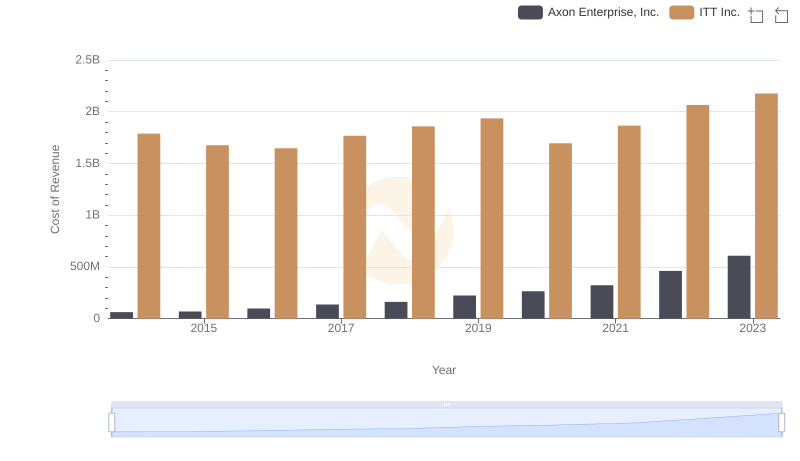
Analyzing Cost of Revenue: Axon Enterprise, Inc. and ITT Inc.
Axon Enterprise, Inc. or American Airlines Group Inc.: Who Leads in Yearly Revenue?
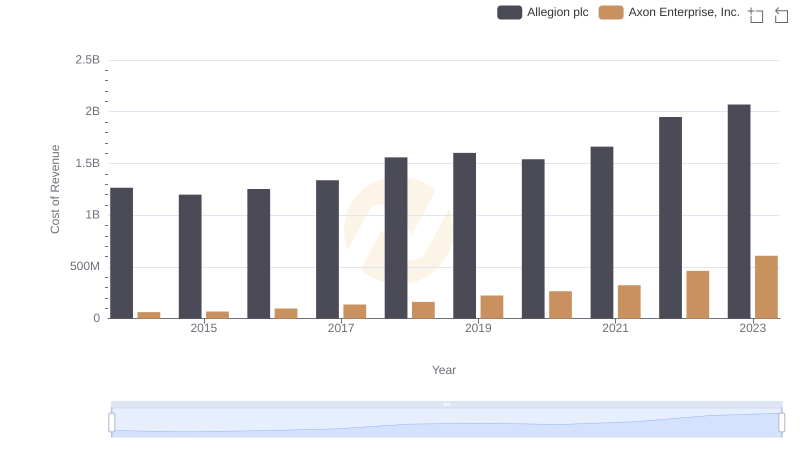
Axon Enterprise, Inc. vs Allegion plc: Efficiency in Cost of Revenue Explored
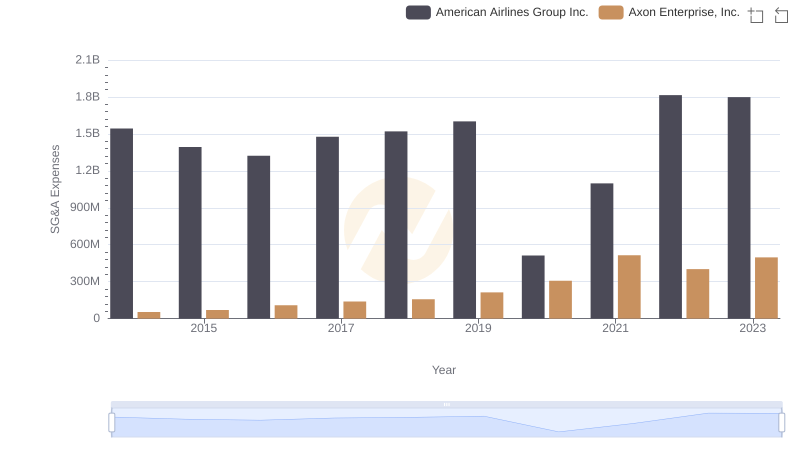
Who Optimizes SG&A Costs Better? Axon Enterprise, Inc. or American Airlines Group Inc.