| __timestamp | AMETEK, Inc. | Nordson Corporation |
|---|---|---|
| Wednesday, January 1, 2014 | 2597017000 | 758923000 |
| Thursday, January 1, 2015 | 2549280000 | 774702000 |
| Friday, January 1, 2016 | 2575220000 | 815495000 |
| Sunday, January 1, 2017 | 2851431000 | 927981000 |
| Monday, January 1, 2018 | 3186310000 | 1018703000 |
| Tuesday, January 1, 2019 | 3370897000 | 1002123000 |
| Wednesday, January 1, 2020 | 2996515000 | 990632000 |
| Friday, January 1, 2021 | 3633900000 | 1038129000 |
| Saturday, January 1, 2022 | 4005261000 | 1163742000 |
| Sunday, January 1, 2023 | 4212484999 | 1203227000 |
| Monday, January 1, 2024 | 0 | 1203792000 |
Unleashing the power of data
In the competitive landscape of industrial manufacturing, understanding cost efficiency is crucial. Over the past decade, AMETEK, Inc. and Nordson Corporation have demonstrated distinct trends in their cost of revenue. From 2014 to 2023, AMETEK's cost of revenue surged by approximately 62%, peaking in 2023. This growth reflects their strategic investments and scaling operations. In contrast, Nordson Corporation's cost of revenue increased by about 59% over the same period, indicating a steady yet controlled expansion.
Interestingly, AMETEK's cost of revenue consistently outpaced Nordson's, highlighting their larger operational scale. However, the data for 2024 is incomplete, with AMETEK's figures missing, suggesting potential reporting delays or strategic shifts. As these companies continue to evolve, monitoring their cost structures will provide valuable insights into their financial health and market strategies.
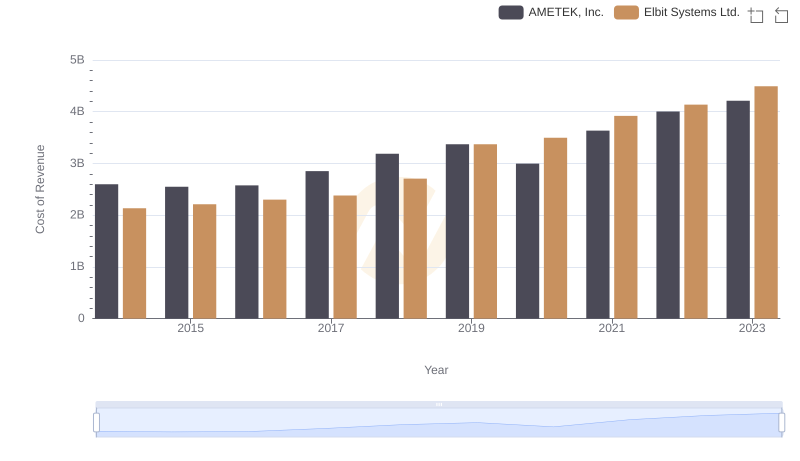
Cost of Revenue Comparison: AMETEK, Inc. vs Elbit Systems Ltd.
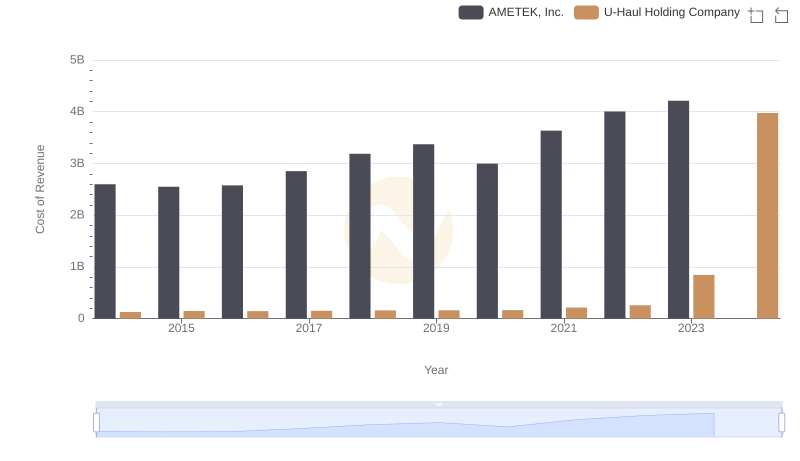
Comparing Cost of Revenue Efficiency: AMETEK, Inc. vs U-Haul Holding Company
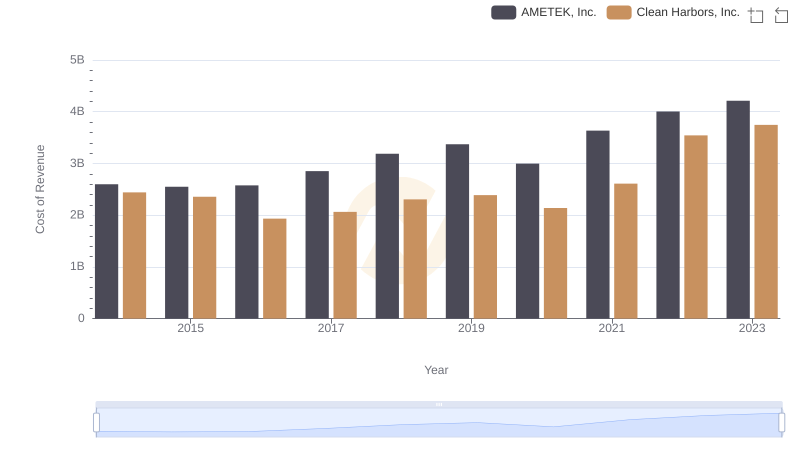
Analyzing Cost of Revenue: AMETEK, Inc. and Clean Harbors, Inc.
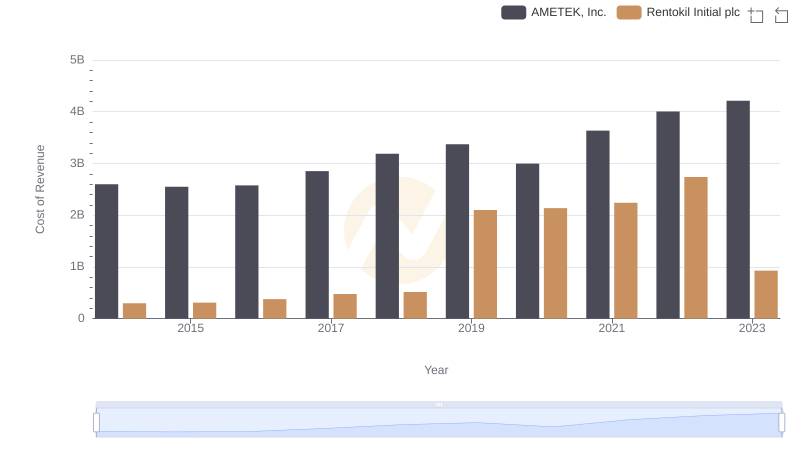
Cost Insights: Breaking Down AMETEK, Inc. and Rentokil Initial plc's Expenses
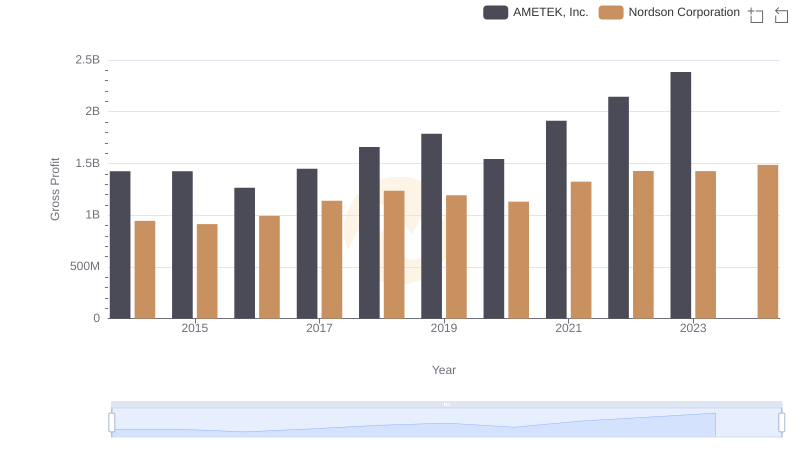
AMETEK, Inc. vs Nordson Corporation: A Gross Profit Performance Breakdown
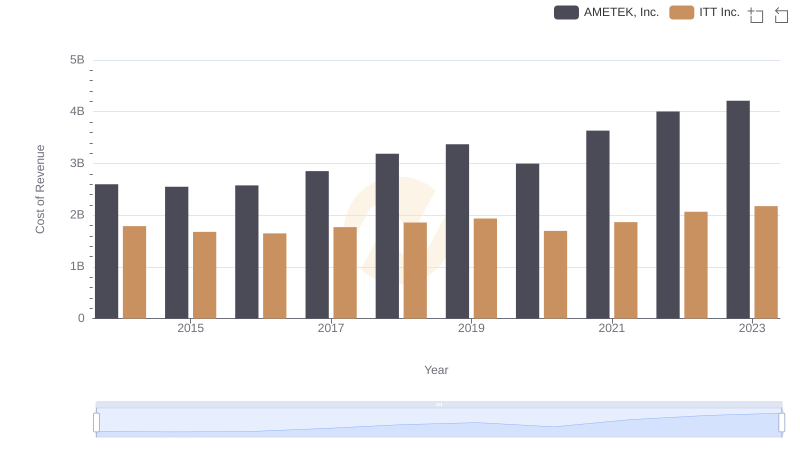
Cost of Revenue Trends: AMETEK, Inc. vs ITT Inc.
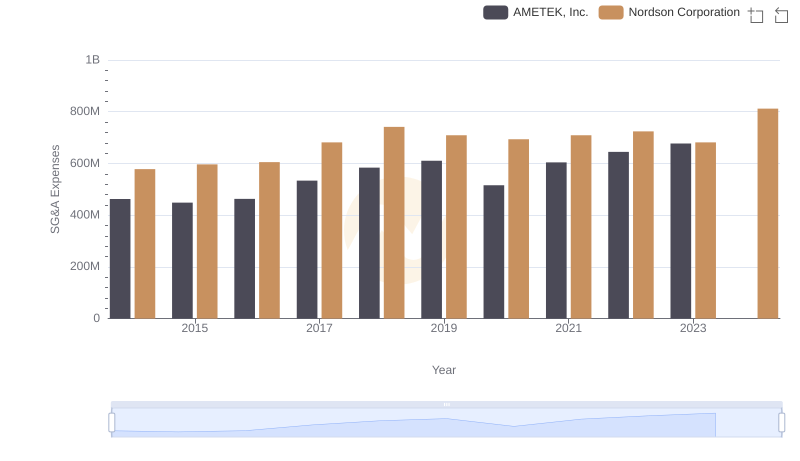
AMETEK, Inc. vs Nordson Corporation: SG&A Expense Trends
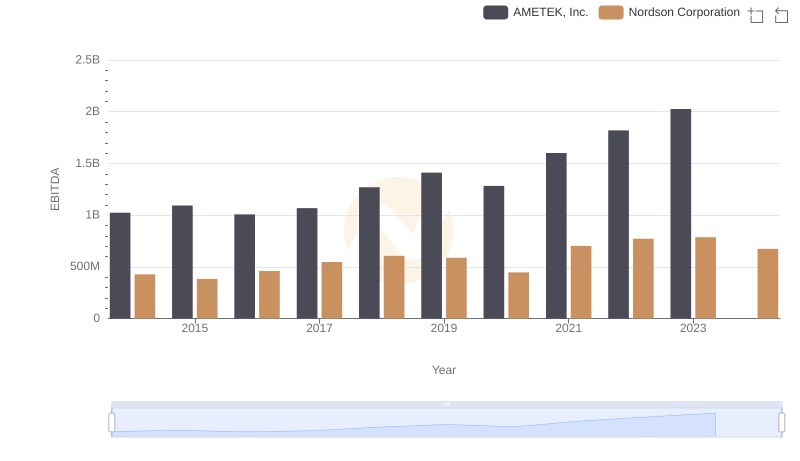
Comparative EBITDA Analysis: AMETEK, Inc. vs Nordson Corporation