| __timestamp | AMETEK, Inc. | American Airlines Group Inc. |
|---|---|---|
| Wednesday, January 1, 2014 | 2597017000 | 31939000000 |
| Thursday, January 1, 2015 | 2549280000 | 27967000000 |
| Friday, January 1, 2016 | 2575220000 | 28339000000 |
| Sunday, January 1, 2017 | 2851431000 | 31154000000 |
| Monday, January 1, 2018 | 3186310000 | 34490000000 |
| Tuesday, January 1, 2019 | 3370897000 | 35379000000 |
| Wednesday, January 1, 2020 | 2996515000 | 24933000000 |
| Friday, January 1, 2021 | 3633900000 | 29855000000 |
| Saturday, January 1, 2022 | 4005261000 | 39934000000 |
| Sunday, January 1, 2023 | 4212484999 | 40978000000 |
| Monday, January 1, 2024 | 0 |
Unveiling the hidden dimensions of data
In the ever-evolving landscape of corporate finance, understanding cost structures is pivotal. This analysis delves into the cost of revenue trends for AMETEK, Inc. and American Airlines Group Inc. from 2014 to 2023. Over this decade, AMETEK, Inc. has seen a steady increase in its cost of revenue, growing by approximately 62% from 2014 to 2023. In contrast, American Airlines Group Inc. experienced a more volatile trajectory, with a notable dip in 2020, likely due to the pandemic's impact on the airline industry. However, by 2023, American Airlines' cost of revenue rebounded to nearly 29% above its 2014 level. This comparative insight highlights the resilience and adaptability of these companies in managing their expenses amidst varying economic conditions. Such financial insights are crucial for investors and stakeholders aiming to make informed decisions.
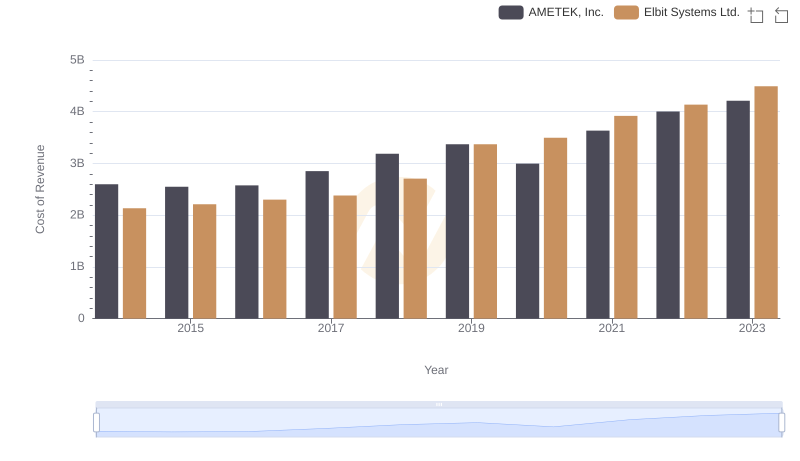
Cost of Revenue Comparison: AMETEK, Inc. vs Elbit Systems Ltd.
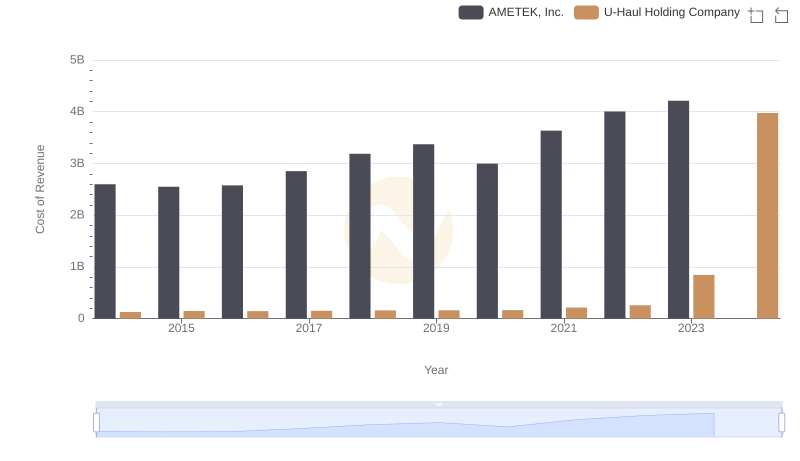
Comparing Cost of Revenue Efficiency: AMETEK, Inc. vs U-Haul Holding Company
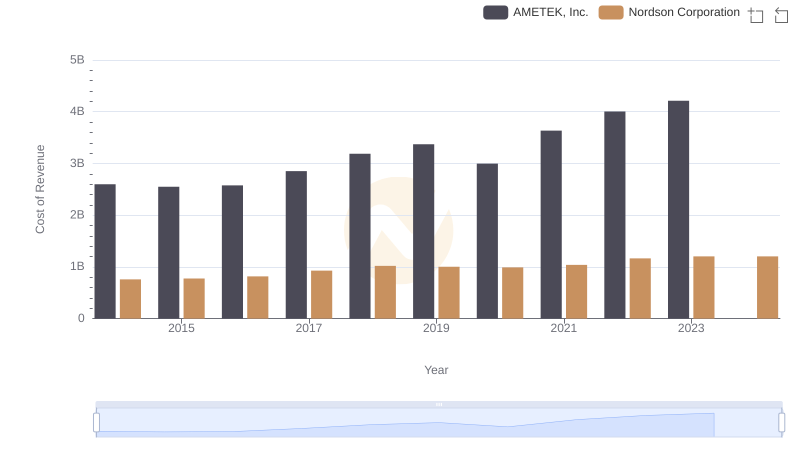
Analyzing Cost of Revenue: AMETEK, Inc. and Nordson Corporation
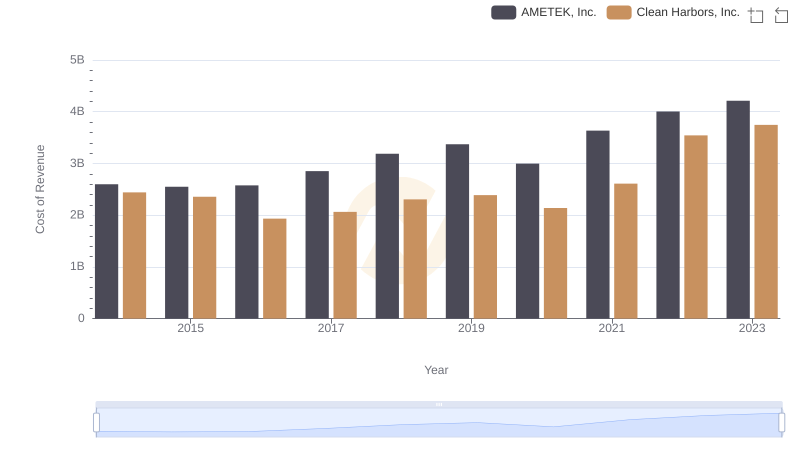
Analyzing Cost of Revenue: AMETEK, Inc. and Clean Harbors, Inc.
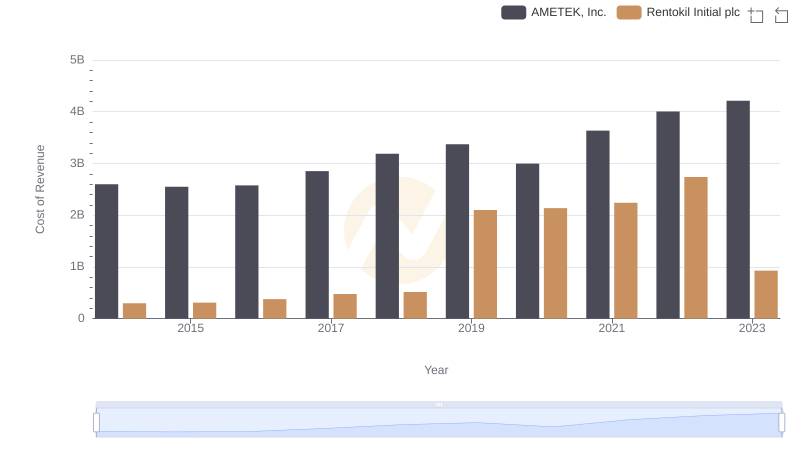
Cost Insights: Breaking Down AMETEK, Inc. and Rentokil Initial plc's Expenses
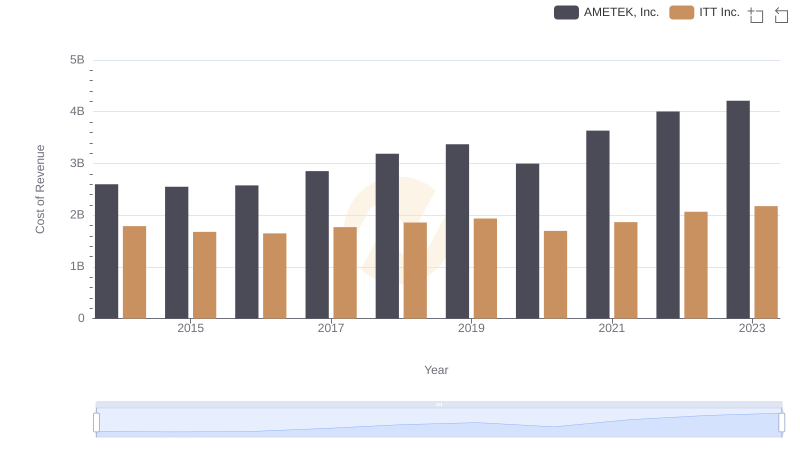
Cost of Revenue Trends: AMETEK, Inc. vs ITT Inc.
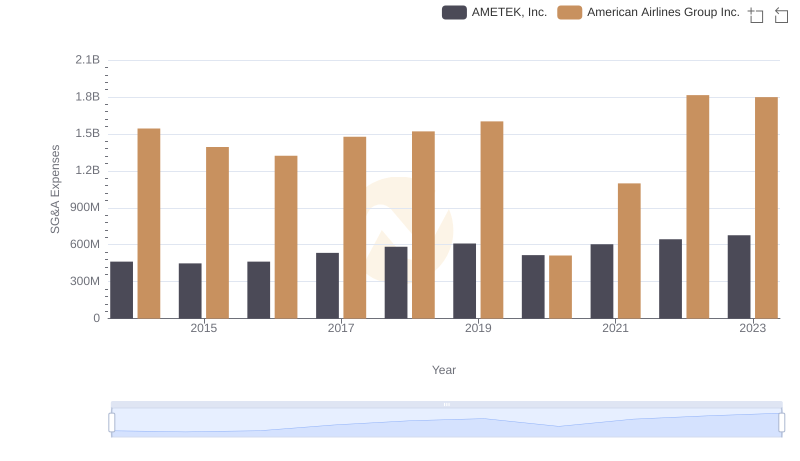
Comparing SG&A Expenses: AMETEK, Inc. vs American Airlines Group Inc. Trends and Insights