| __timestamp | AMETEK, Inc. | U-Haul Holding Company |
|---|---|---|
| Wednesday, January 1, 2014 | 2597017000 | 127270000 |
| Thursday, January 1, 2015 | 2549280000 | 146072000 |
| Friday, January 1, 2016 | 2575220000 | 144990000 |
| Sunday, January 1, 2017 | 2851431000 | 152485000 |
| Monday, January 1, 2018 | 3186310000 | 160489000 |
| Tuesday, January 1, 2019 | 3370897000 | 162142000 |
| Wednesday, January 1, 2020 | 2996515000 | 164018000 |
| Friday, January 1, 2021 | 3633900000 | 214059000 |
| Saturday, January 1, 2022 | 4005261000 | 259585000 |
| Sunday, January 1, 2023 | 4212484999 | 844894000 |
| Monday, January 1, 2024 | 0 | 3976040000 |
In pursuit of knowledge
In the ever-evolving landscape of corporate efficiency, AMETEK, Inc. and U-Haul Holding Company present a fascinating study in contrasts. Over the past decade, AMETEK has consistently demonstrated a robust cost of revenue, peaking in 2023 with a 62% increase from 2014. This growth underscores AMETEK's strategic prowess in managing production costs while scaling operations.
Conversely, U-Haul's cost of revenue trajectory reveals a more volatile path. Despite a modest start in 2014, U-Haul's costs surged dramatically by 2023, reflecting a nearly sevenfold increase. This spike, particularly in 2024, suggests a strategic pivot or market expansion, though data for AMETEK in 2024 remains elusive.
These trends highlight the diverse strategies employed by these industry giants, offering valuable insights into their operational efficiencies and market adaptations.
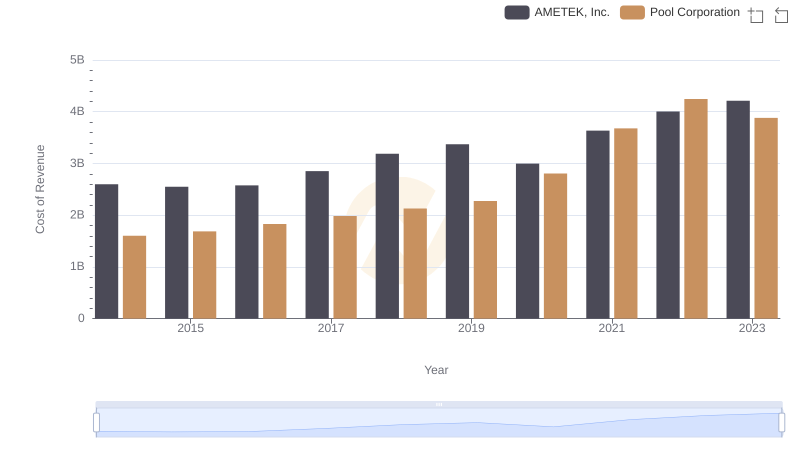
Cost of Revenue: Key Insights for AMETEK, Inc. and Pool Corporation
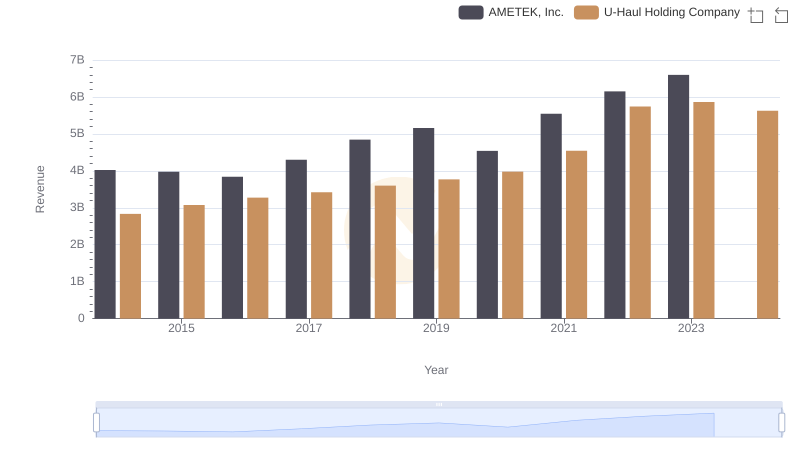
AMETEK, Inc. vs U-Haul Holding Company: Annual Revenue Growth Compared
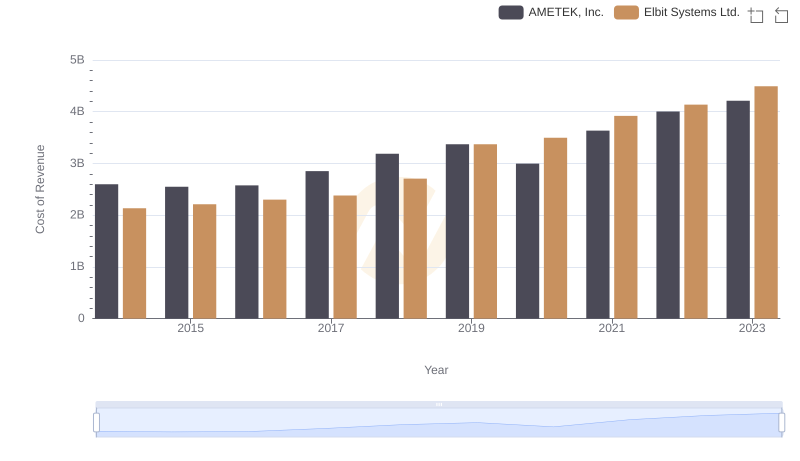
Cost of Revenue Comparison: AMETEK, Inc. vs Elbit Systems Ltd.
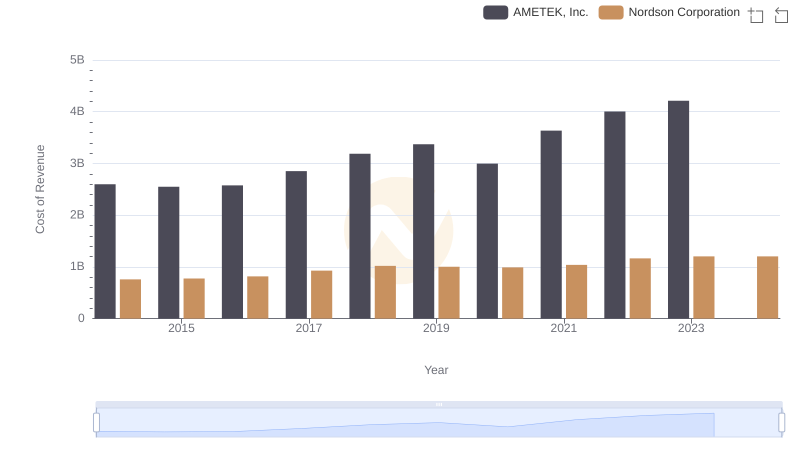
Analyzing Cost of Revenue: AMETEK, Inc. and Nordson Corporation
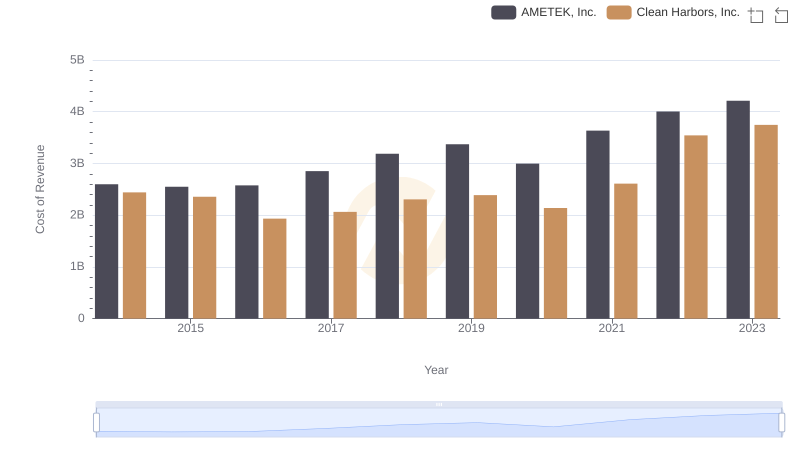
Analyzing Cost of Revenue: AMETEK, Inc. and Clean Harbors, Inc.
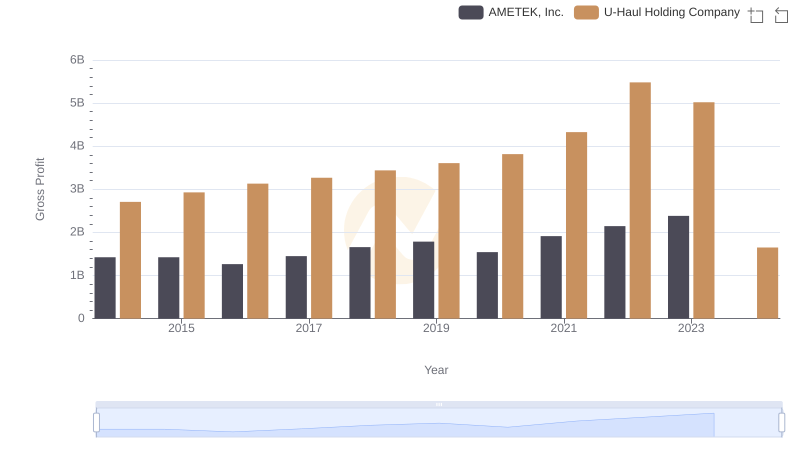
AMETEK, Inc. vs U-Haul Holding Company: A Gross Profit Performance Breakdown
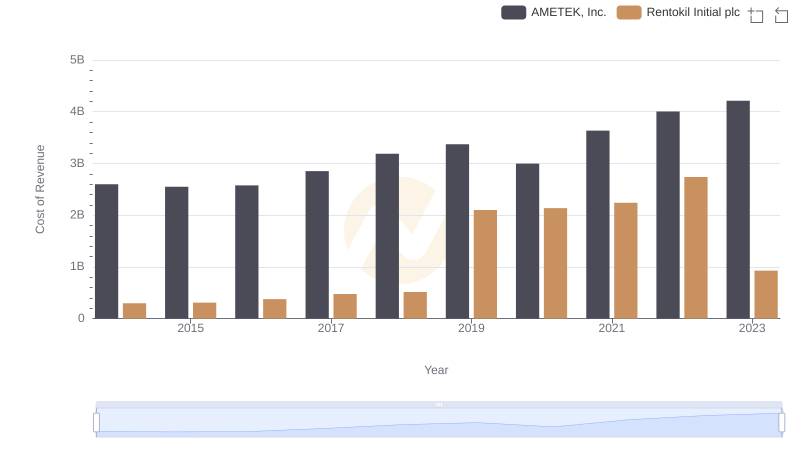
Cost Insights: Breaking Down AMETEK, Inc. and Rentokil Initial plc's Expenses
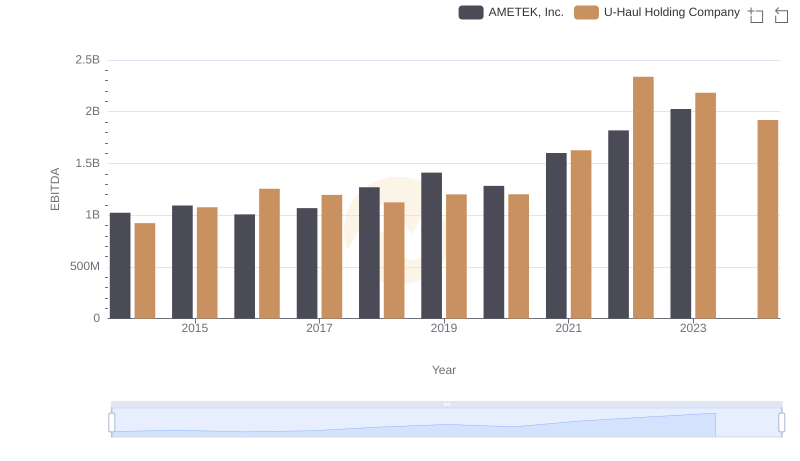
EBITDA Analysis: Evaluating AMETEK, Inc. Against U-Haul Holding Company