| __timestamp | AMETEK, Inc. | Graco Inc. |
|---|---|---|
| Wednesday, January 1, 2014 | 4021964000 | 1221130000 |
| Thursday, January 1, 2015 | 3974295000 | 1286485000 |
| Friday, January 1, 2016 | 3840087000 | 1329293000 |
| Sunday, January 1, 2017 | 4300170000 | 1474744000 |
| Monday, January 1, 2018 | 4845872000 | 1653292000 |
| Tuesday, January 1, 2019 | 5158557000 | 1646045000 |
| Wednesday, January 1, 2020 | 4540029000 | 1650115000 |
| Friday, January 1, 2021 | 5546514000 | 1987608000 |
| Saturday, January 1, 2022 | 6150530000 | 2143521000 |
| Sunday, January 1, 2023 | 6596950000 | 2195606000 |
| Monday, January 1, 2024 | 6941180000 | 2113316000 |
Unleashing insights
In the competitive landscape of industrial manufacturing, AMETEK, Inc. and Graco Inc. have showcased remarkable revenue trajectories over the past decade. From 2014 to 2023, AMETEK, Inc. has seen its annual revenue grow by approximately 64%, peaking at $6.6 billion in 2023. This growth reflects a robust expansion strategy and a strong market presence. Meanwhile, Graco Inc. has also demonstrated steady growth, with its revenue increasing by about 80% over the same period, reaching $2.2 billion in 2023. This consistent upward trend highlights Graco's resilience and adaptability in a dynamic market. Notably, the data for 2024 is incomplete, indicating potential fluctuations or strategic shifts. As these industry giants continue to evolve, their financial performance offers valuable insights into the broader trends shaping the industrial sector.
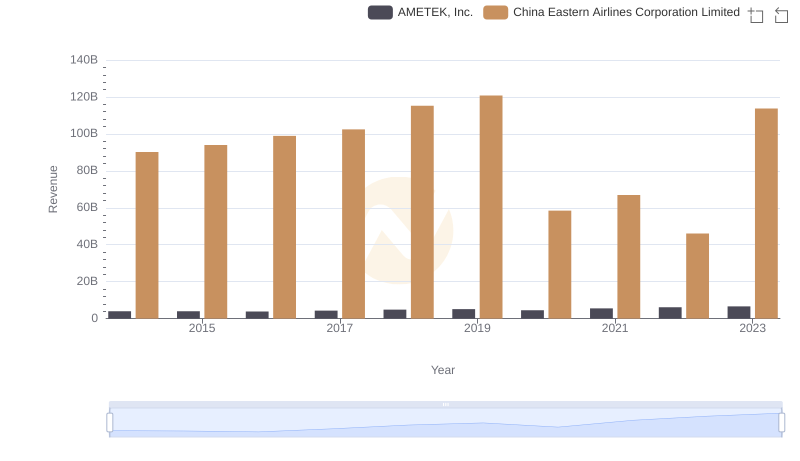
AMETEK, Inc. or China Eastern Airlines Corporation Limited: Who Leads in Yearly Revenue?
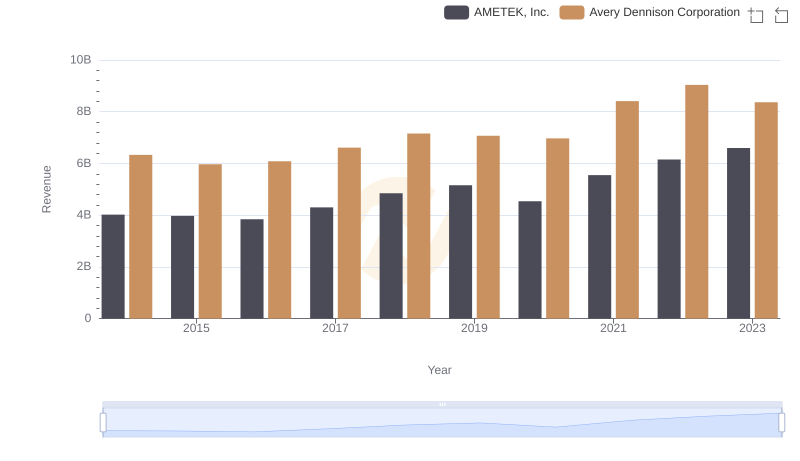
Breaking Down Revenue Trends: AMETEK, Inc. vs Avery Dennison Corporation
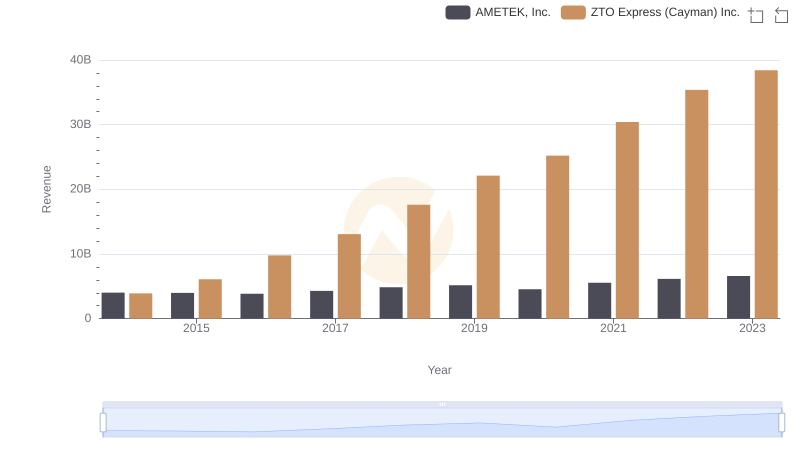
AMETEK, Inc. and ZTO Express (Cayman) Inc.: A Comprehensive Revenue Analysis
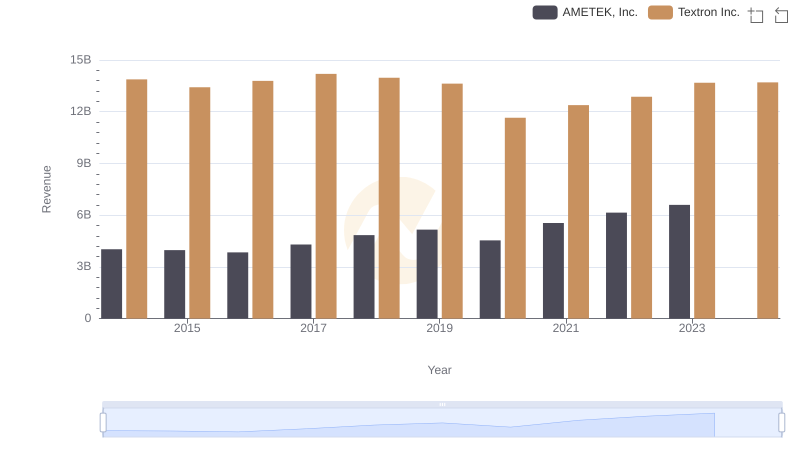
Breaking Down Revenue Trends: AMETEK, Inc. vs Textron Inc.
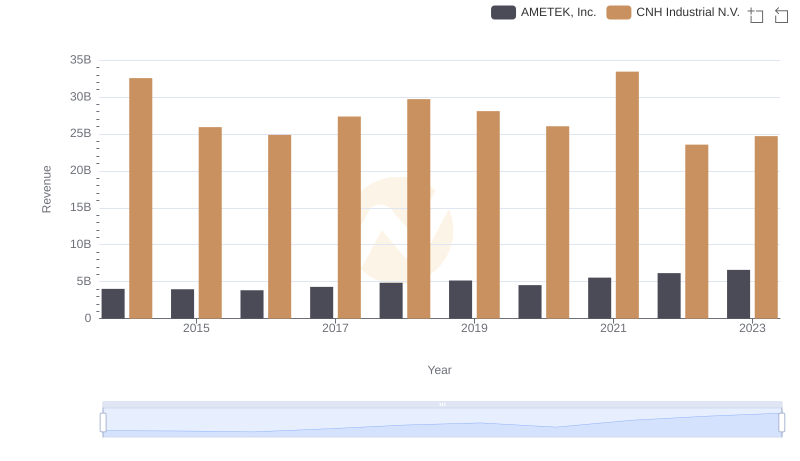
AMETEK, Inc. and CNH Industrial N.V.: A Comprehensive Revenue Analysis
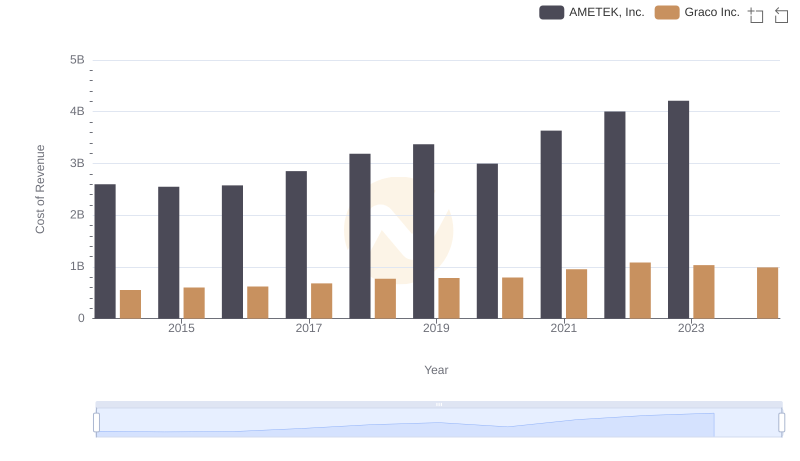
Cost of Revenue Trends: AMETEK, Inc. vs Graco Inc.
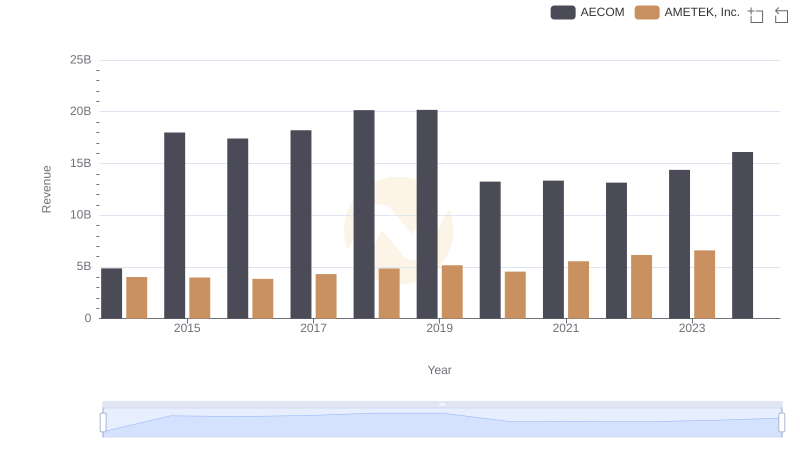
Who Generates More Revenue? AMETEK, Inc. or AECOM
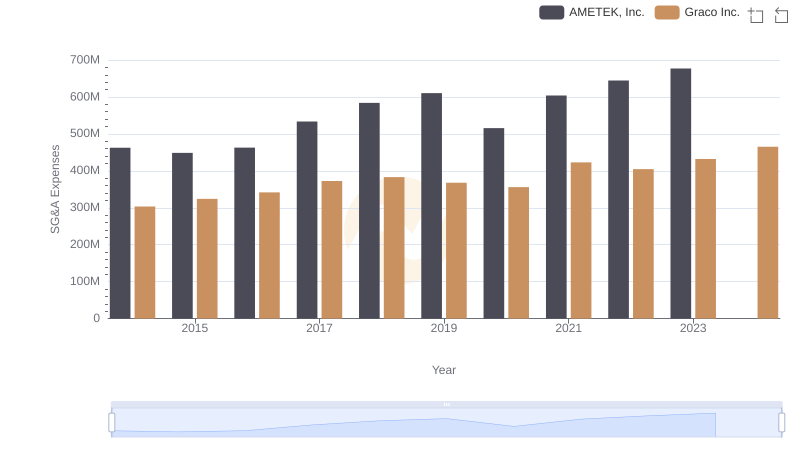
AMETEK, Inc. or Graco Inc.: Who Manages SG&A Costs Better?
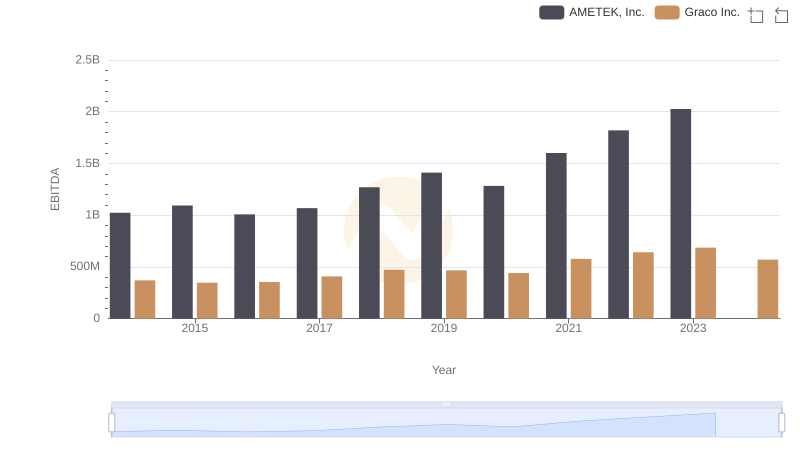
AMETEK, Inc. and Graco Inc.: A Detailed Examination of EBITDA Performance