| __timestamp | AECOM | AMETEK, Inc. |
|---|---|---|
| Wednesday, January 1, 2014 | 4452451000 | 2597017000 |
| Thursday, January 1, 2015 | 17454692000 | 2549280000 |
| Friday, January 1, 2016 | 16768001000 | 2575220000 |
| Sunday, January 1, 2017 | 17519682000 | 2851431000 |
| Monday, January 1, 2018 | 19504863000 | 3186310000 |
| Tuesday, January 1, 2019 | 19359884000 | 3370897000 |
| Wednesday, January 1, 2020 | 12530416000 | 2996515000 |
| Friday, January 1, 2021 | 12542431000 | 3633900000 |
| Saturday, January 1, 2022 | 12300208000 | 4005261000 |
| Sunday, January 1, 2023 | 13432996000 | 4212484999 |
| Monday, January 1, 2024 | 15021157000 | 0 |
Unleashing the power of data
In the ever-evolving landscape of industrial and infrastructure sectors, understanding cost dynamics is crucial. From 2014 to 2023, AECOM's cost of revenue showcased a remarkable 200% increase, peaking in 2018 with a 19.5 billion USD expenditure. This reflects AECOM's aggressive expansion and project execution strategies. In contrast, AMETEK, Inc. maintained a more stable trajectory, with costs rising by approximately 62% over the same period, reaching a high of 4.2 billion USD in 2023. This stability underscores AMETEK's focus on efficiency and cost management. Notably, 2020 marked a dip for both companies, likely due to global disruptions. As we look to 2024, AECOM's data remains incomplete, hinting at potential strategic shifts. These insights offer a window into the operational priorities and market positioning of these industry giants.
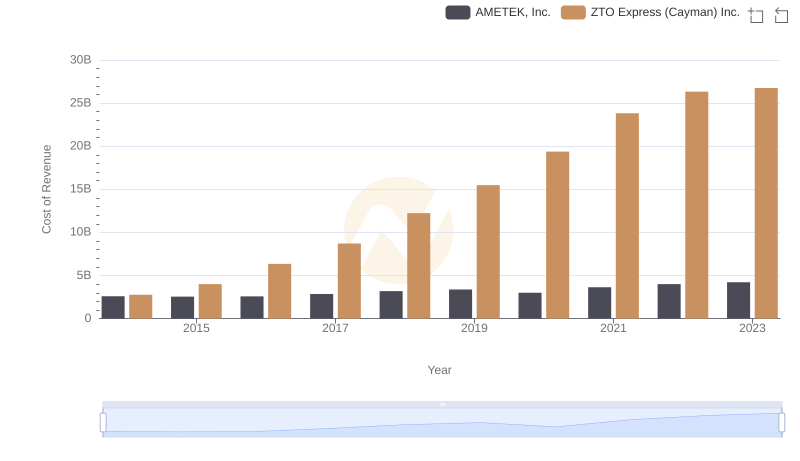
Cost Insights: Breaking Down AMETEK, Inc. and ZTO Express (Cayman) Inc.'s Expenses
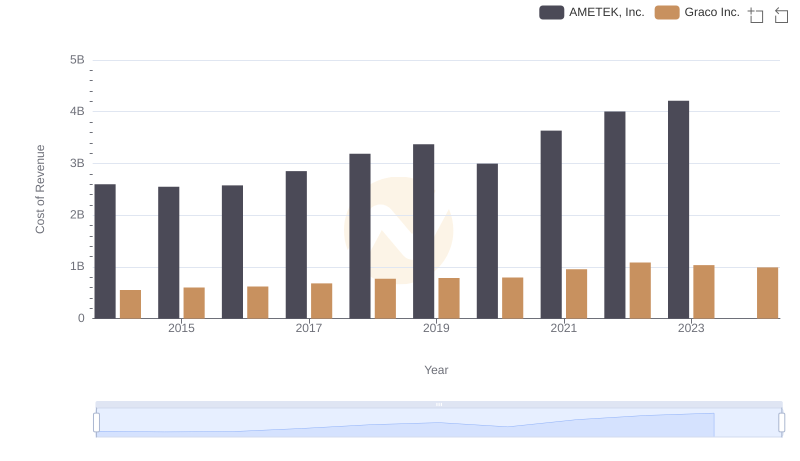
Cost of Revenue Trends: AMETEK, Inc. vs Graco Inc.
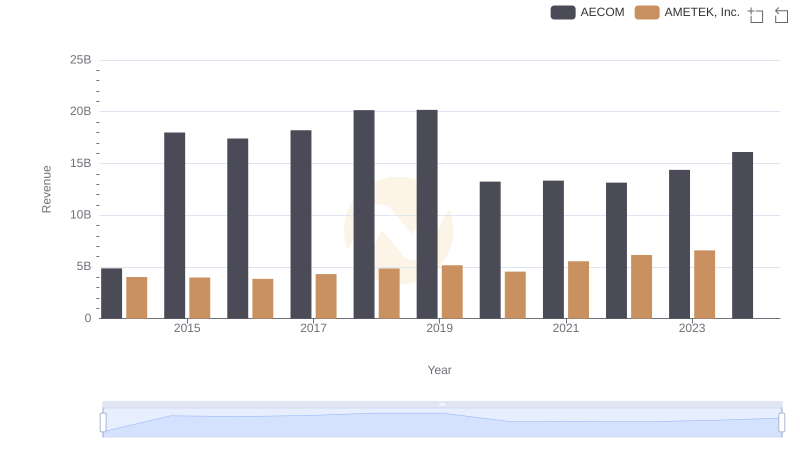
Who Generates More Revenue? AMETEK, Inc. or AECOM
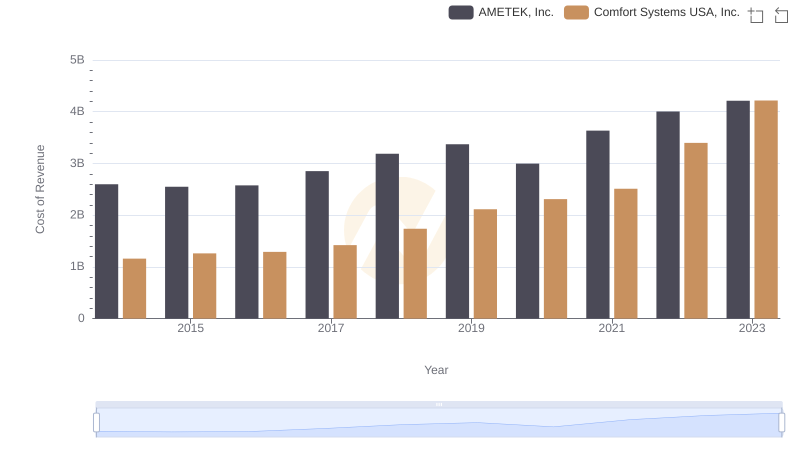
Cost of Revenue Comparison: AMETEK, Inc. vs Comfort Systems USA, Inc.
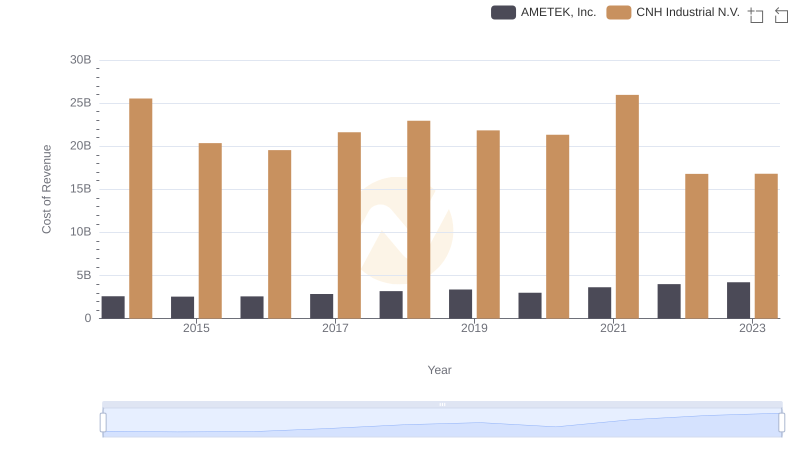
Cost Insights: Breaking Down AMETEK, Inc. and CNH Industrial N.V.'s Expenses
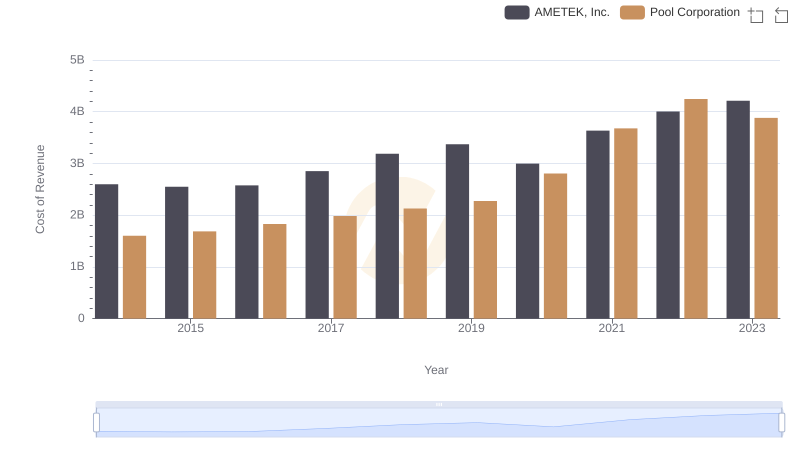
Cost of Revenue: Key Insights for AMETEK, Inc. and Pool Corporation
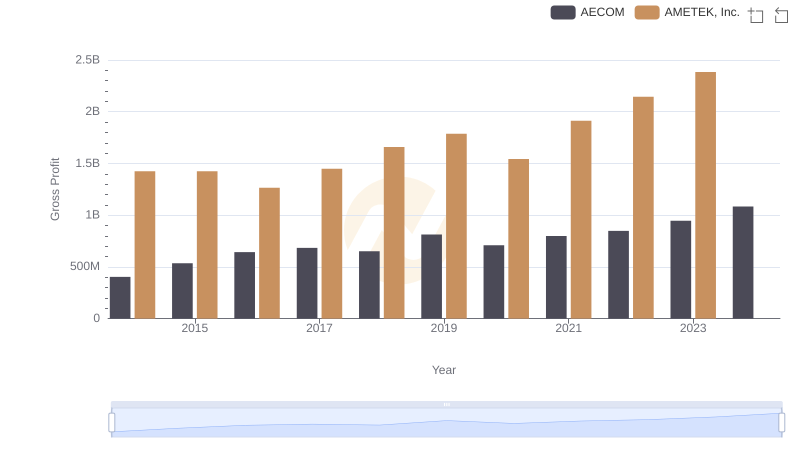
Gross Profit Trends Compared: AMETEK, Inc. vs AECOM
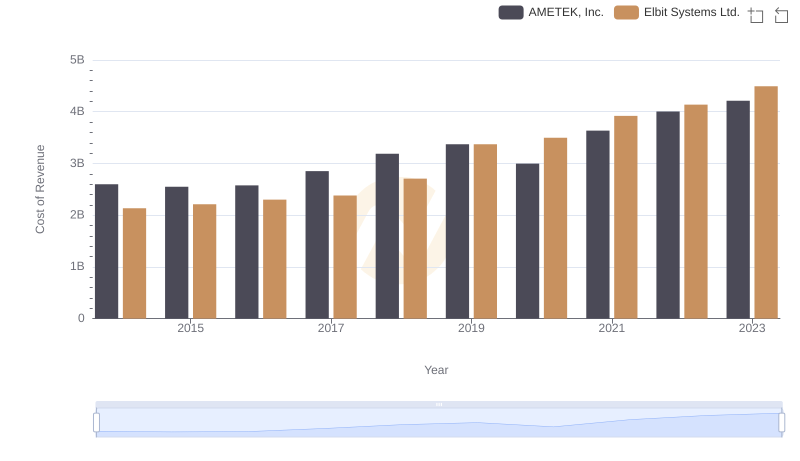
Cost of Revenue Comparison: AMETEK, Inc. vs Elbit Systems Ltd.
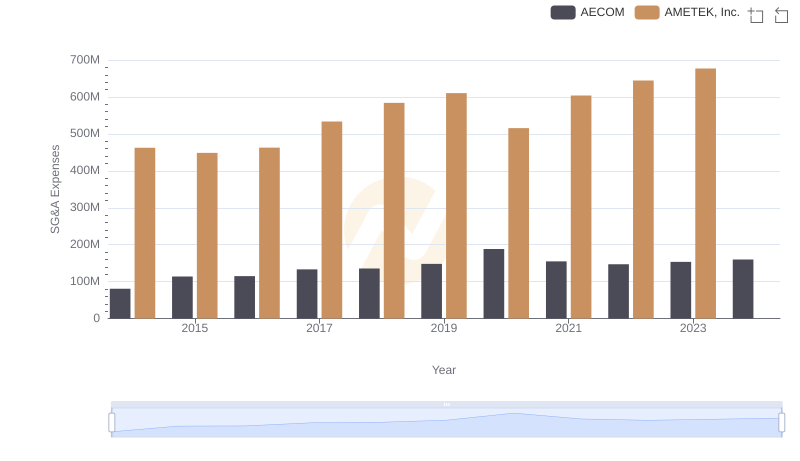
SG&A Efficiency Analysis: Comparing AMETEK, Inc. and AECOM
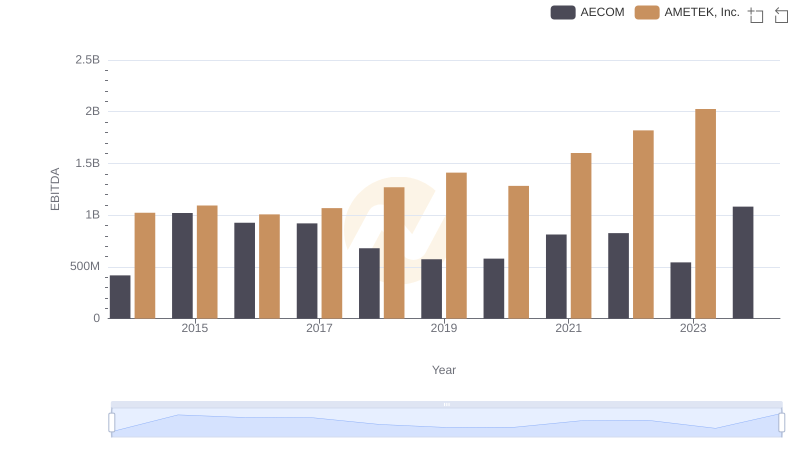
AMETEK, Inc. and AECOM: A Detailed Examination of EBITDA Performance