| __timestamp | AMETEK, Inc. | CNH Industrial N.V. |
|---|---|---|
| Wednesday, January 1, 2014 | 2597017000 | 25534000000 |
| Thursday, January 1, 2015 | 2549280000 | 20357000000 |
| Friday, January 1, 2016 | 2575220000 | 19539000000 |
| Sunday, January 1, 2017 | 2851431000 | 21621000000 |
| Monday, January 1, 2018 | 3186310000 | 22958000000 |
| Tuesday, January 1, 2019 | 3370897000 | 21832000000 |
| Wednesday, January 1, 2020 | 2996515000 | 21327000000 |
| Friday, January 1, 2021 | 3633900000 | 25951000000 |
| Saturday, January 1, 2022 | 4005261000 | 16797000000 |
| Sunday, January 1, 2023 | 4212484999 | 16805000000 |
| Monday, January 1, 2024 | 0 |
Unveiling the hidden dimensions of data
In the ever-evolving landscape of industrial manufacturing, understanding cost structures is pivotal. AMETEK, Inc. and CNH Industrial N.V., two giants in the sector, offer a fascinating study in contrasts. Over the past decade, AMETEK's cost of revenue has seen a steady climb, peaking at approximately $4.2 billion in 2023, marking a 62% increase from 2014. In contrast, CNH Industrial's expenses have fluctuated, with a notable dip to $16.8 billion in 2022, a 34% decrease from its 2014 high. This divergence highlights AMETEK's consistent growth strategy versus CNH's adaptive cost management. As we delve into these trends, the data underscores the importance of strategic financial planning in maintaining competitive advantage in the industrial sector.
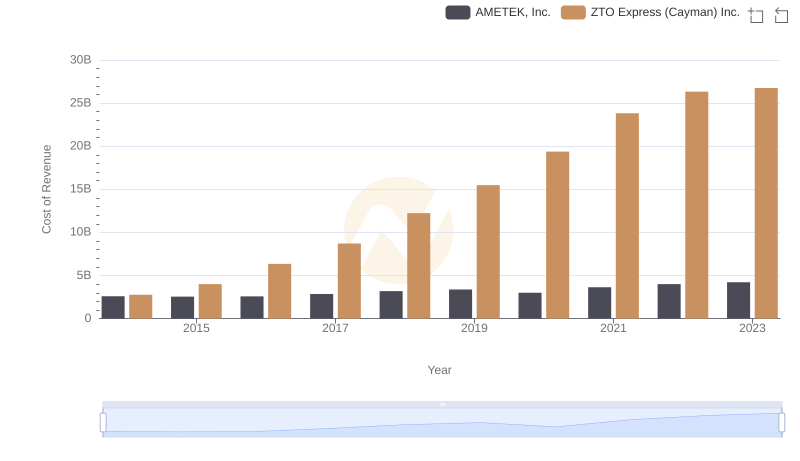
Cost Insights: Breaking Down AMETEK, Inc. and ZTO Express (Cayman) Inc.'s Expenses
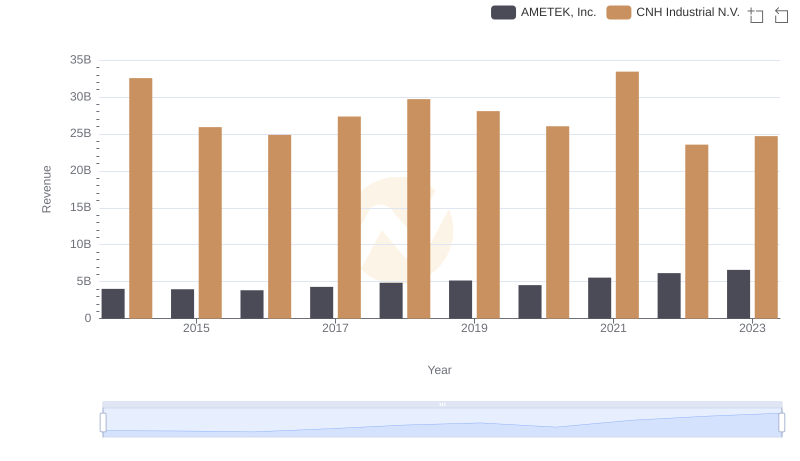
AMETEK, Inc. and CNH Industrial N.V.: A Comprehensive Revenue Analysis
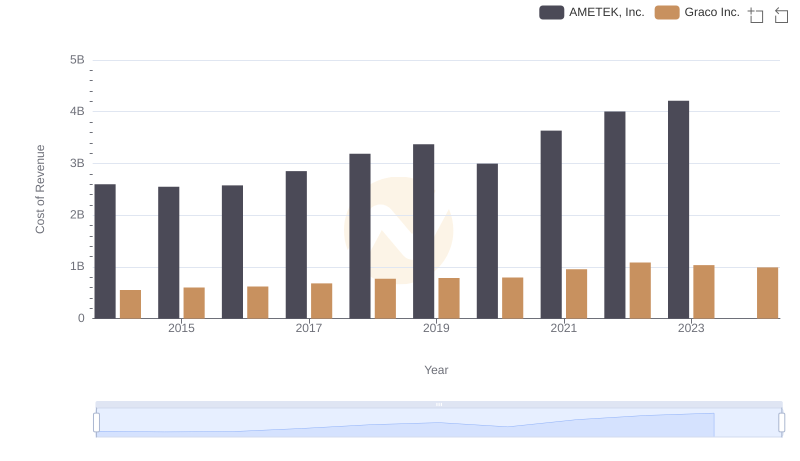
Cost of Revenue Trends: AMETEK, Inc. vs Graco Inc.
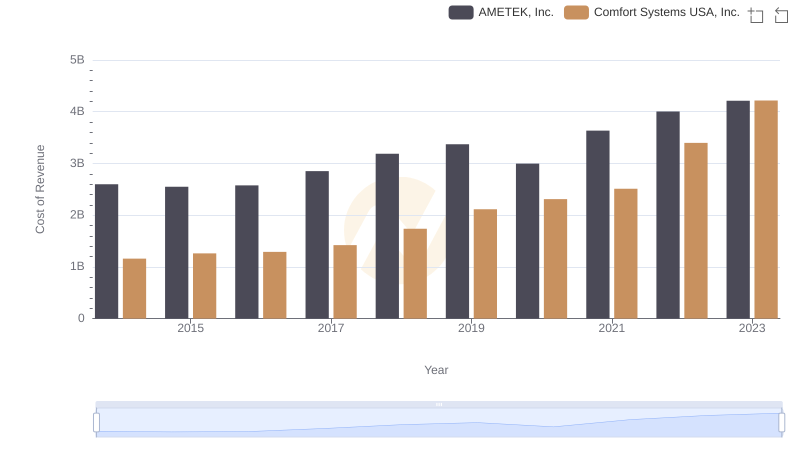
Cost of Revenue Comparison: AMETEK, Inc. vs Comfort Systems USA, Inc.
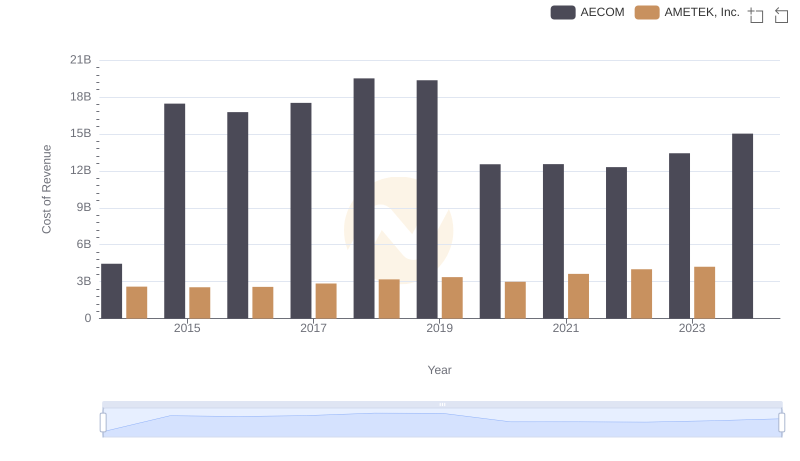
Cost of Revenue: Key Insights for AMETEK, Inc. and AECOM
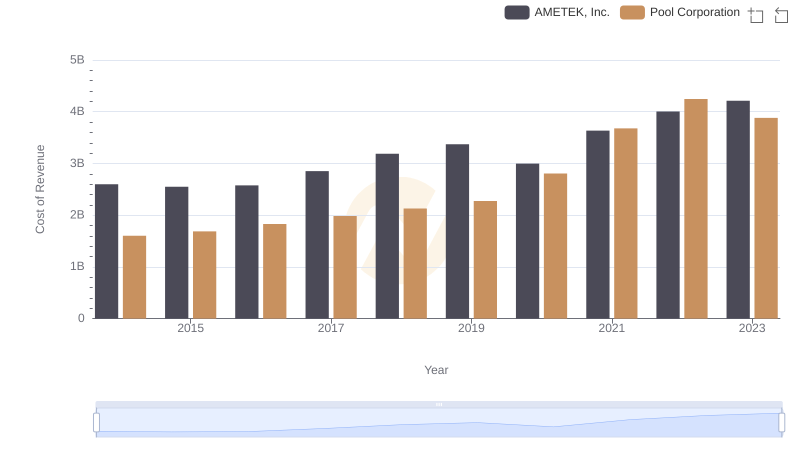
Cost of Revenue: Key Insights for AMETEK, Inc. and Pool Corporation
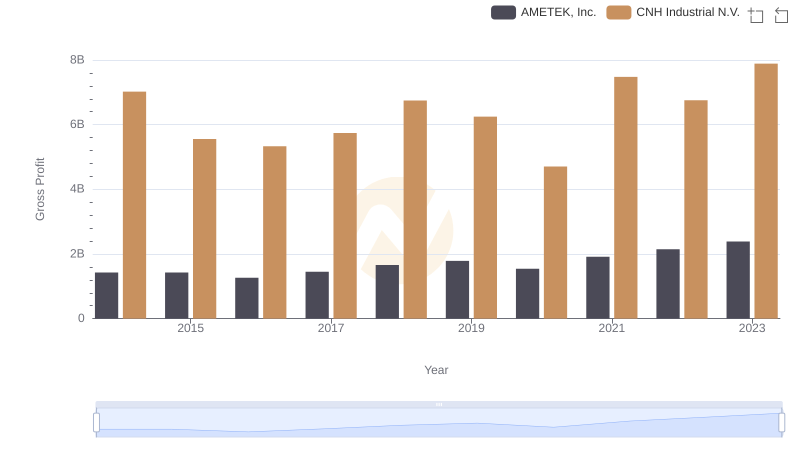
Gross Profit Trends Compared: AMETEK, Inc. vs CNH Industrial N.V.
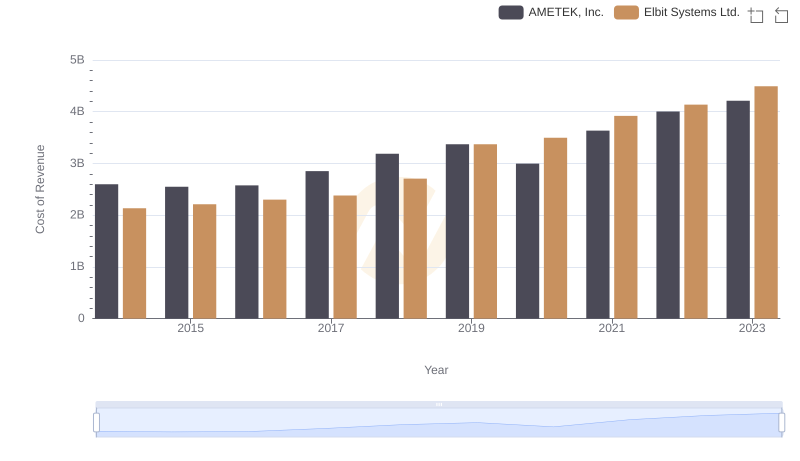
Cost of Revenue Comparison: AMETEK, Inc. vs Elbit Systems Ltd.
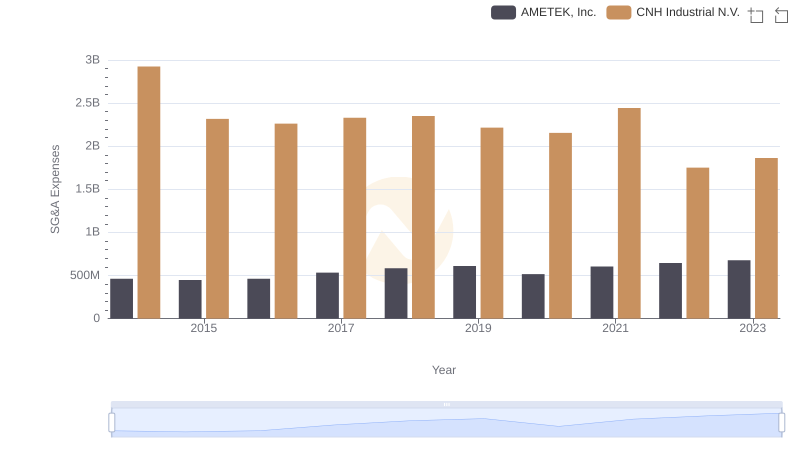
Who Optimizes SG&A Costs Better? AMETEK, Inc. or CNH Industrial N.V.