| __timestamp | TransUnion | Waste Management, Inc. |
|---|---|---|
| Wednesday, January 1, 2014 | 499100000 | 9002000000 |
| Thursday, January 1, 2015 | 531600000 | 8231000000 |
| Friday, January 1, 2016 | 579100000 | 8486000000 |
| Sunday, January 1, 2017 | 645700000 | 9021000000 |
| Monday, January 1, 2018 | 790100000 | 9249000000 |
| Tuesday, January 1, 2019 | 874100000 | 9496000000 |
| Wednesday, January 1, 2020 | 920400000 | 9341000000 |
| Friday, January 1, 2021 | 991600000 | 11111000000 |
| Saturday, January 1, 2022 | 1222900000 | 12294000000 |
| Sunday, January 1, 2023 | 1517300000 | 12606000000 |
| Monday, January 1, 2024 | 0 | 13383000000 |
Infusing magic into the data realm
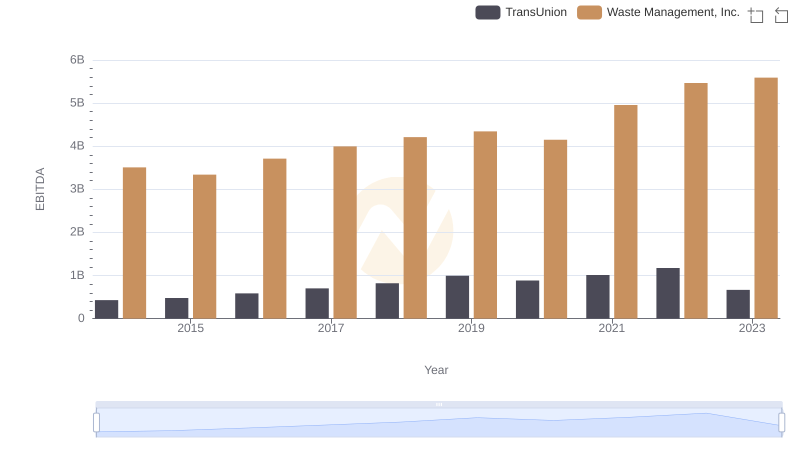
In the ever-evolving landscape of corporate finance, understanding the cost of revenue is crucial for assessing a company's efficiency and profitability. This analysis delves into the cost of revenue trends for Waste Management, Inc. and TransUnion from 2014 to 2023. Over this period, Waste Management, Inc. consistently outpaced TransUnion, with its cost of revenue peaking at approximately $12.6 billion in 2023, marking a 40% increase from 2014. In contrast, TransUnion's cost of revenue grew by over 200%, reaching around $1.5 billion in 2023. This stark difference highlights Waste Management's larger operational scale, while TransUnion's rapid growth reflects its expanding market presence. These insights provide a window into the strategic financial maneuvers of these industry giants, offering valuable lessons for investors and analysts alike.
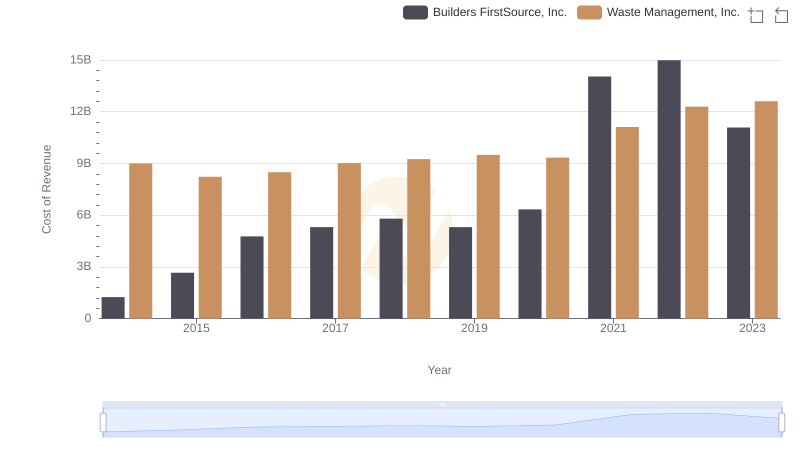
Cost Insights: Breaking Down Waste Management, Inc. and Builders FirstSource, Inc.'s Expenses
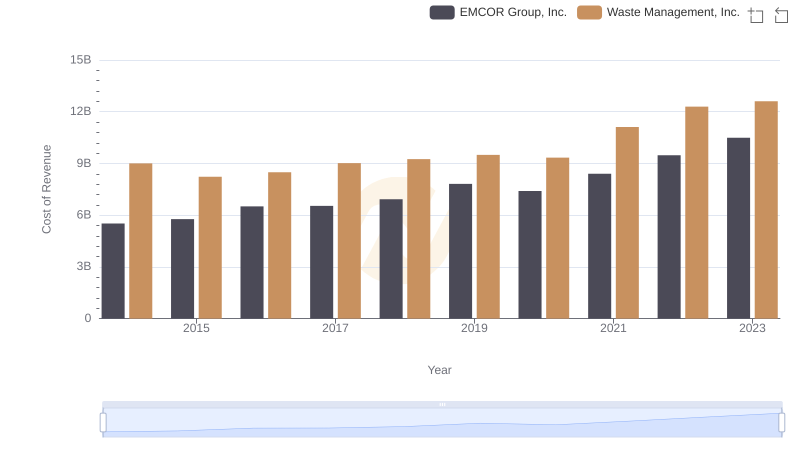
Cost Insights: Breaking Down Waste Management, Inc. and EMCOR Group, Inc.'s Expenses
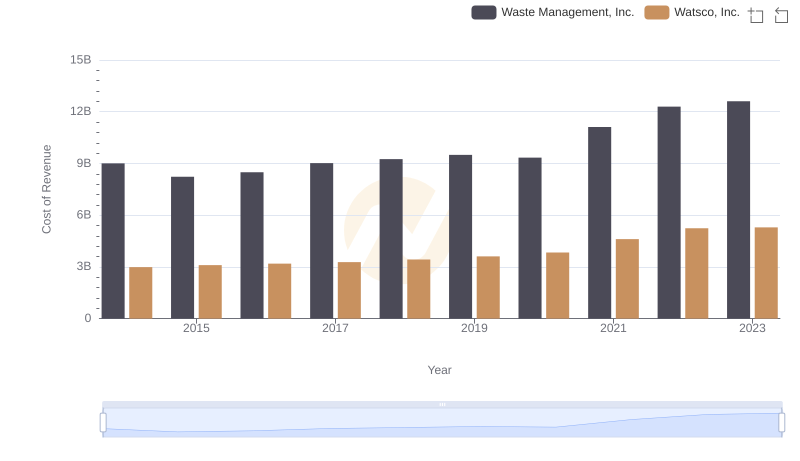
Cost of Revenue Comparison: Waste Management, Inc. vs Watsco, Inc.
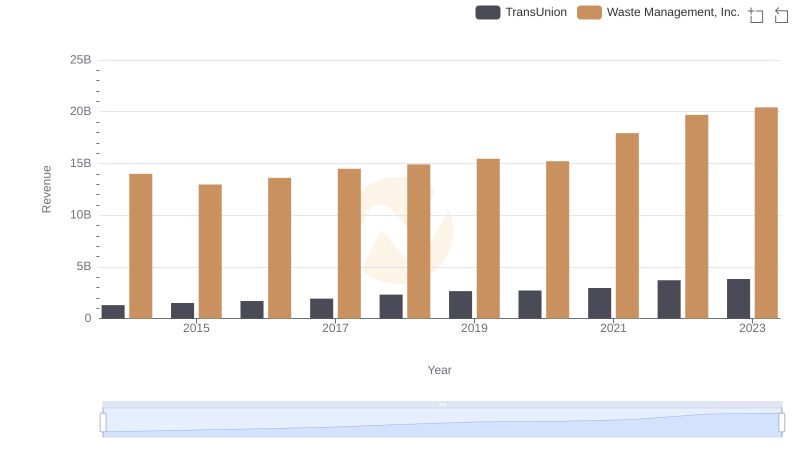
Waste Management, Inc. and TransUnion: A Comprehensive Revenue Analysis
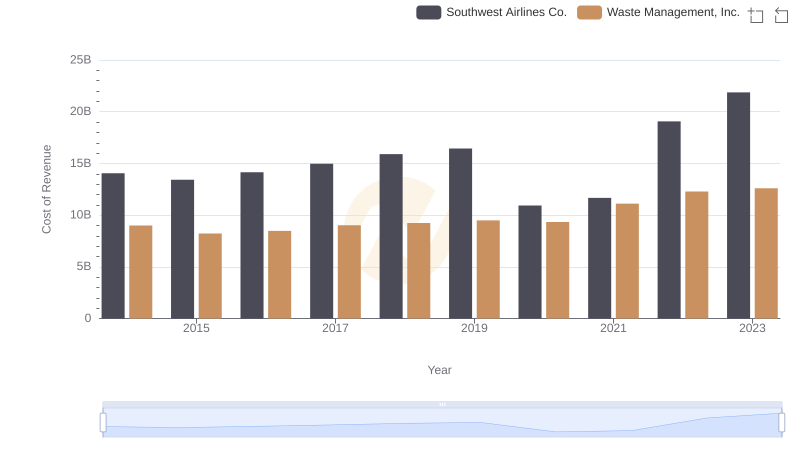
Cost of Revenue Comparison: Waste Management, Inc. vs Southwest Airlines Co.
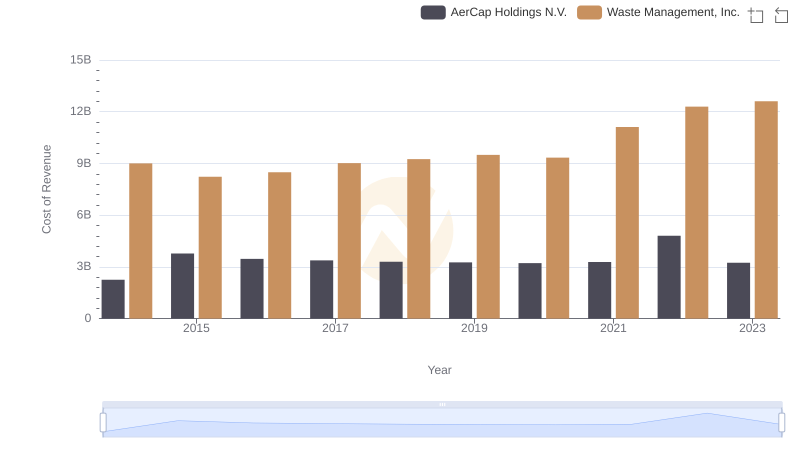
Cost of Revenue: Key Insights for Waste Management, Inc. and AerCap Holdings N.V.
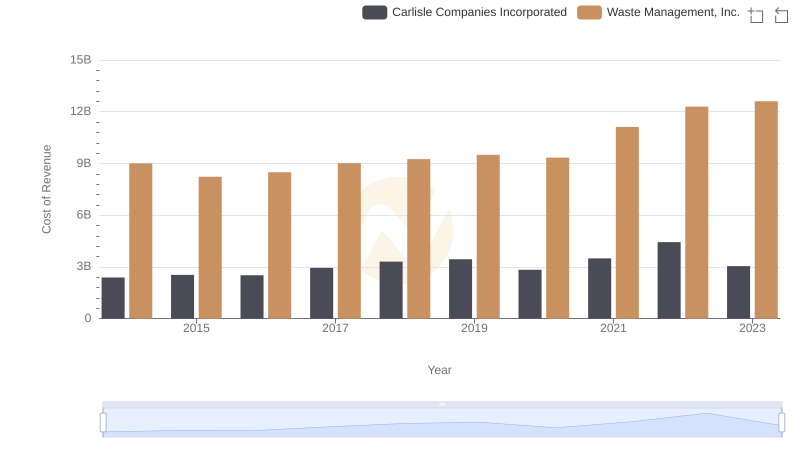
Waste Management, Inc. vs Carlisle Companies Incorporated: Efficiency in Cost of Revenue Explored
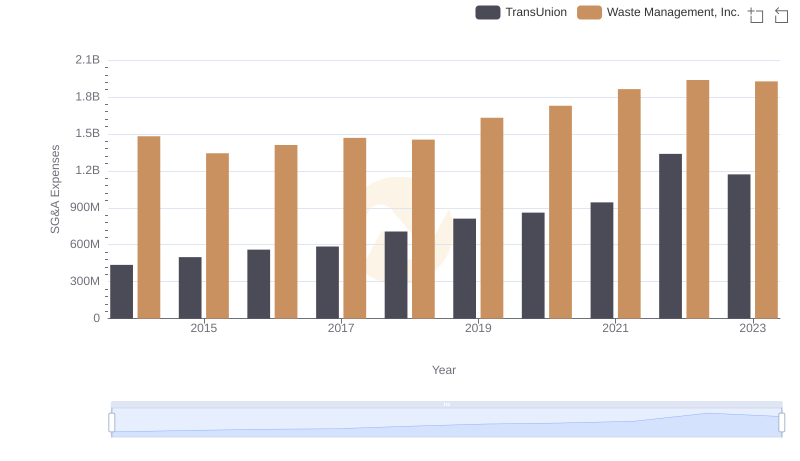
Breaking Down SG&A Expenses: Waste Management, Inc. vs TransUnion
A Professional Review of EBITDA: Waste Management, Inc. Compared to TransUnion