| __timestamp | TFI International Inc. | United Rentals, Inc. |
|---|---|---|
| Wednesday, January 1, 2014 | 2782605137 | 3253000000 |
| Thursday, January 1, 2015 | 2551474032 | 3337000000 |
| Friday, January 1, 2016 | 2636493564 | 3359000000 |
| Sunday, January 1, 2017 | 3364979721 | 3872000000 |
| Monday, January 1, 2018 | 3251443800 | 4683000000 |
| Tuesday, January 1, 2019 | 3461987950 | 5681000000 |
| Wednesday, January 1, 2020 | 3239249000 | 5347000000 |
| Friday, January 1, 2021 | 6182566000 | 5863000000 |
| Saturday, January 1, 2022 | 7385640000 | 6646000000 |
| Sunday, January 1, 2023 | 6255775000 | 8519000000 |
| Monday, January 1, 2024 | 9195000000 |
Igniting the spark of knowledge
In the ever-evolving landscape of industrial services, understanding cost structures is pivotal. United Rentals, Inc. and TFI International Inc., two giants in their respective fields, offer a fascinating glimpse into how expenses have evolved over the past decade. From 2014 to 2023, United Rentals saw a steady increase in its cost of revenue, peaking at approximately $8.5 billion in 2023, marking a 162% rise from 2014. Meanwhile, TFI International's costs surged by 168% during the same period, reaching a high of $7.4 billion in 2022. Notably, 2024 data for TFI International is missing, leaving a gap in the trend analysis. This comparative study not only highlights the growth trajectories of these companies but also underscores the dynamic nature of cost management in the industrial sector.
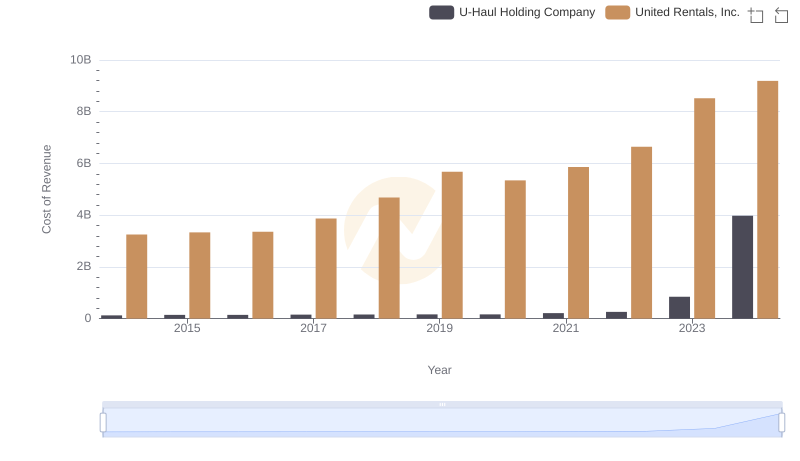
Cost of Revenue Comparison: United Rentals, Inc. vs U-Haul Holding Company
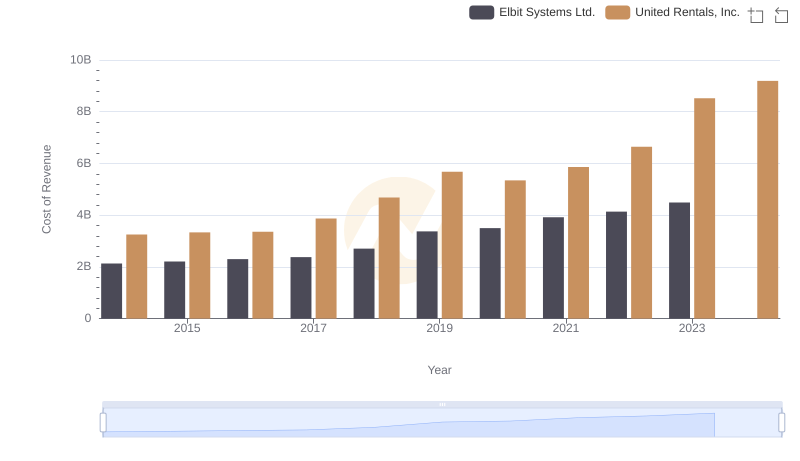
Comparing Cost of Revenue Efficiency: United Rentals, Inc. vs Elbit Systems Ltd.
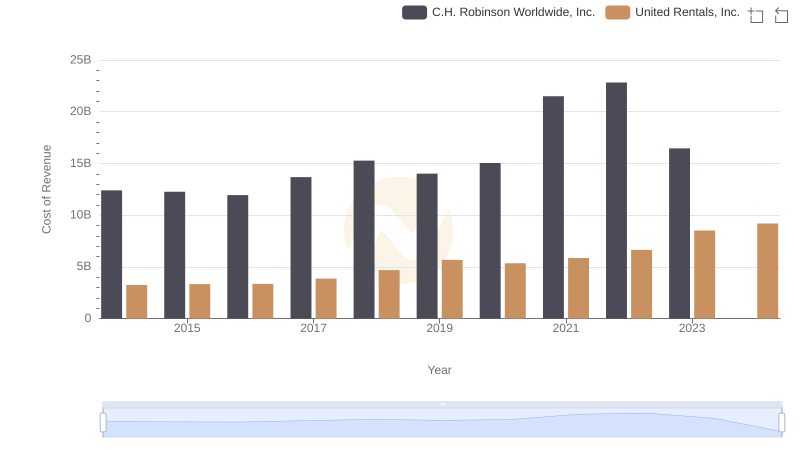
United Rentals, Inc. vs C.H. Robinson Worldwide, Inc.: Efficiency in Cost of Revenue Explored
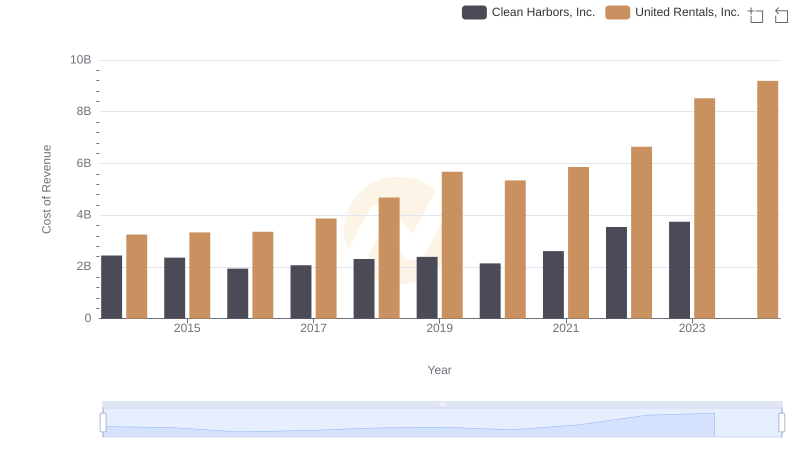
Cost of Revenue: Key Insights for United Rentals, Inc. and Clean Harbors, Inc.
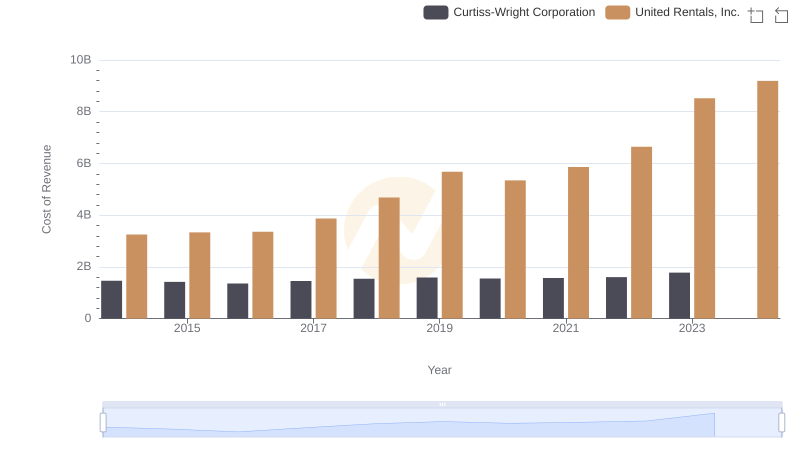
Cost of Revenue Trends: United Rentals, Inc. vs Curtiss-Wright Corporation
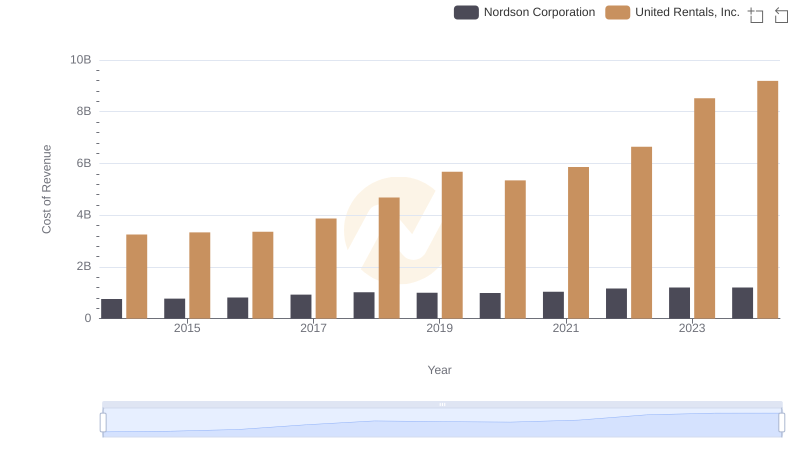
Comparing Cost of Revenue Efficiency: United Rentals, Inc. vs Nordson Corporation
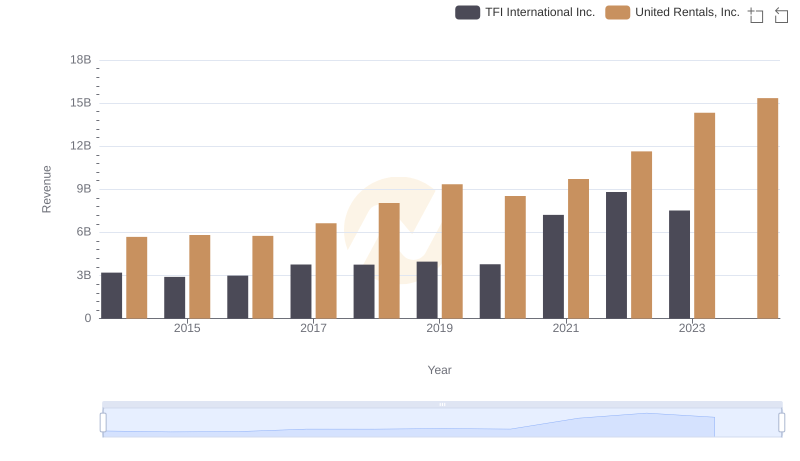
Who Generates More Revenue? United Rentals, Inc. or TFI International Inc.
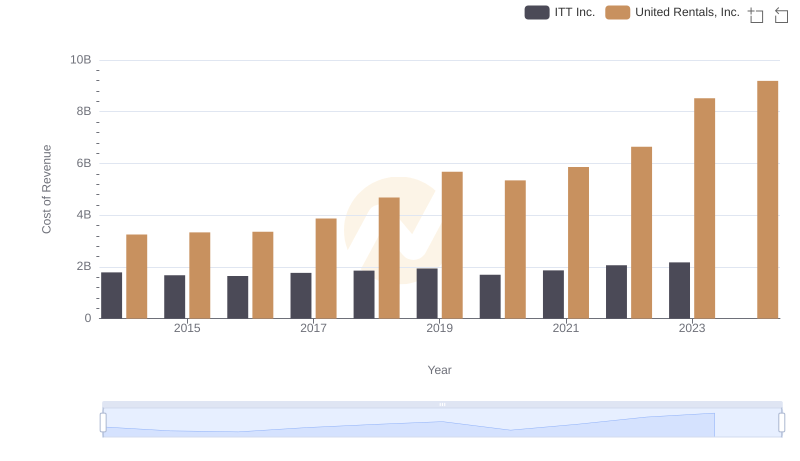
Cost of Revenue Comparison: United Rentals, Inc. vs ITT Inc.
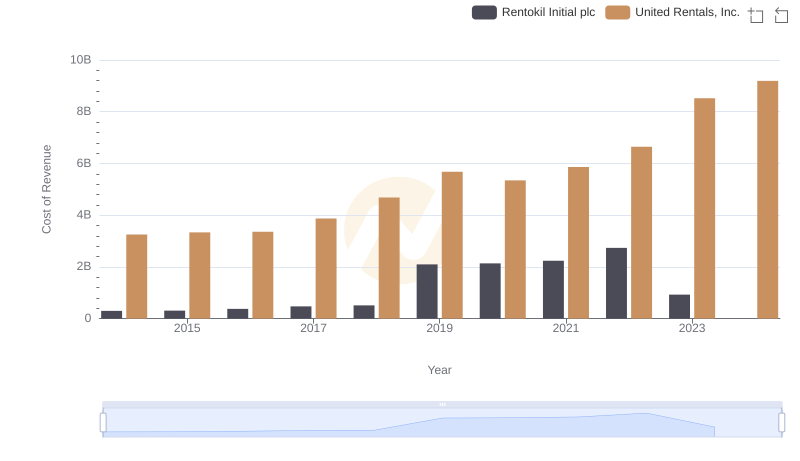
Cost of Revenue: Key Insights for United Rentals, Inc. and Rentokil Initial plc
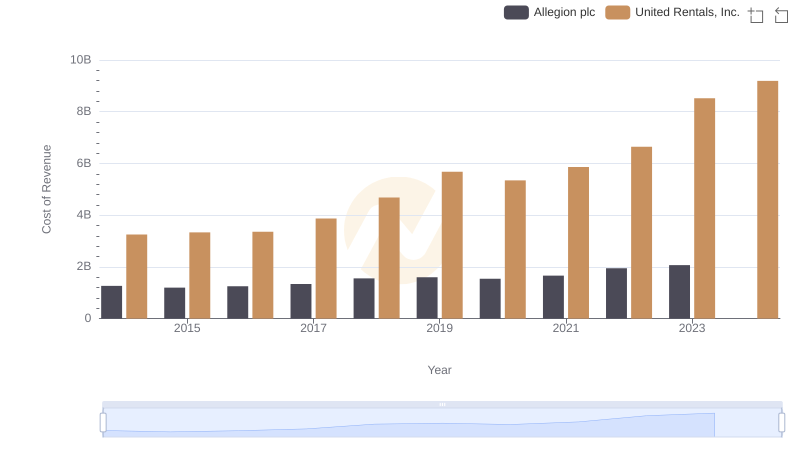
Cost of Revenue: Key Insights for United Rentals, Inc. and Allegion plc
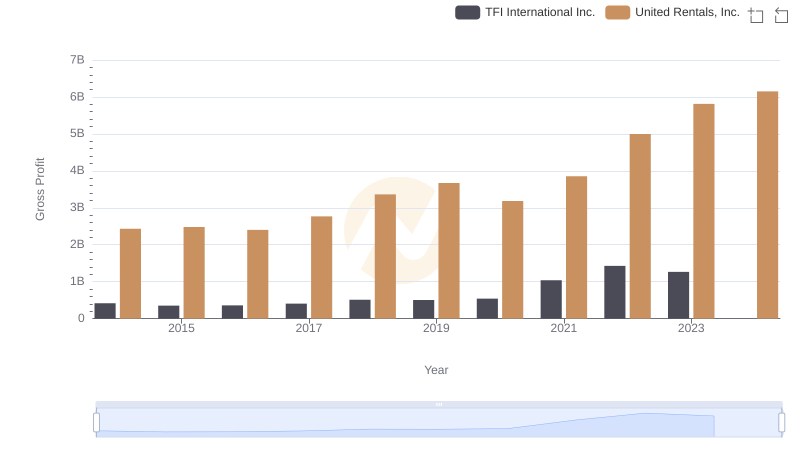
Gross Profit Trends Compared: United Rentals, Inc. vs TFI International Inc.
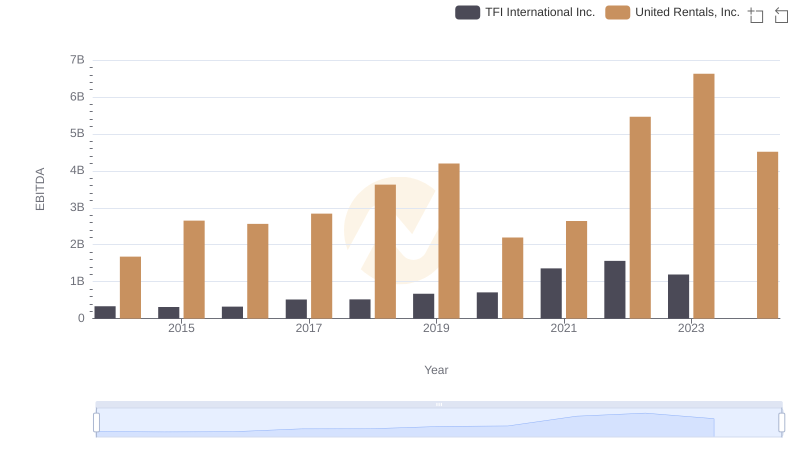
A Professional Review of EBITDA: United Rentals, Inc. Compared to TFI International Inc.