| __timestamp | Old Dominion Freight Line, Inc. | Pool Corporation |
|---|---|---|
| Wednesday, January 1, 2014 | 2100409000 | 1603222000 |
| Thursday, January 1, 2015 | 2214943000 | 1687495000 |
| Friday, January 1, 2016 | 2246890000 | 1829716000 |
| Sunday, January 1, 2017 | 2482732000 | 1982899000 |
| Monday, January 1, 2018 | 2899452000 | 2127924000 |
| Tuesday, January 1, 2019 | 2938895000 | 2274592000 |
| Wednesday, January 1, 2020 | 2786531000 | 2805721000 |
| Friday, January 1, 2021 | 3481268000 | 3678492000 |
| Saturday, January 1, 2022 | 4003951000 | 4246315000 |
| Sunday, January 1, 2023 | 3793953000 | 3881551000 |
Data in motion
In the ever-evolving landscape of logistics and distribution, understanding cost dynamics is crucial. Old Dominion Freight Line, Inc. and Pool Corporation, two industry giants, have shown intriguing trends in their cost of revenue over the past decade. From 2014 to 2023, Old Dominion's cost of revenue surged by approximately 81%, peaking in 2022. Meanwhile, Pool Corporation experienced a 165% increase, with its highest cost recorded in 2022 as well. This growth reflects broader industry trends, where operational costs have been influenced by factors such as fuel prices, labor costs, and supply chain disruptions. Notably, both companies saw a slight decline in 2023, hinting at potential efficiency improvements or market adjustments. As these companies navigate the complexities of their respective sectors, monitoring cost of revenue remains a key indicator of financial health and strategic positioning.
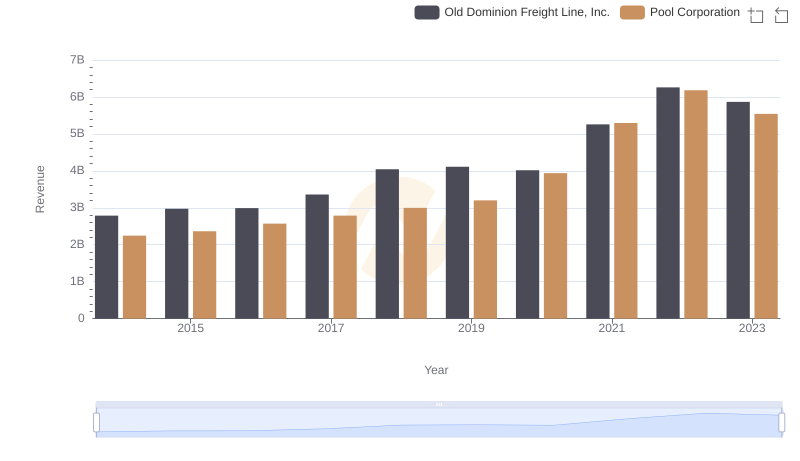
Breaking Down Revenue Trends: Old Dominion Freight Line, Inc. vs Pool Corporation
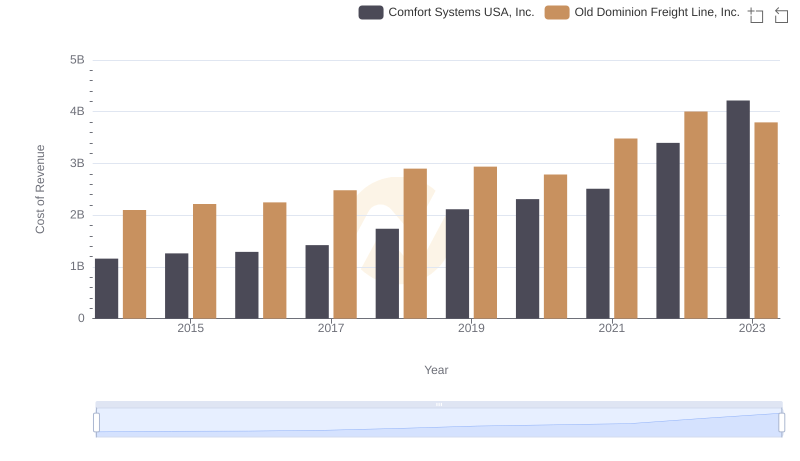
Analyzing Cost of Revenue: Old Dominion Freight Line, Inc. and Comfort Systems USA, Inc.
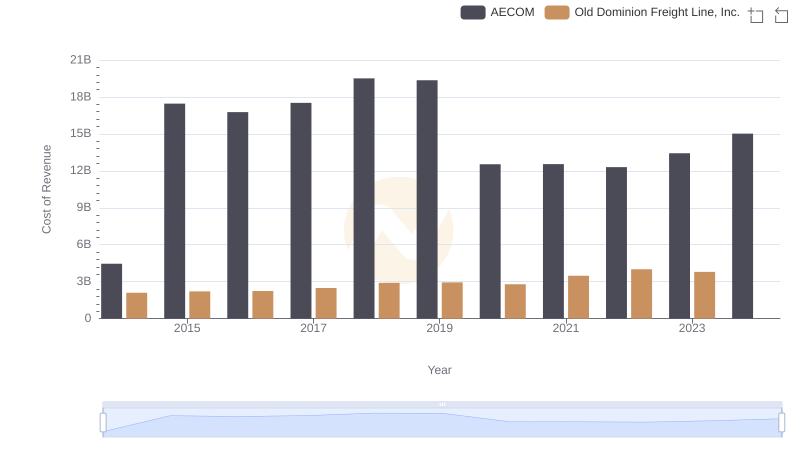
Cost of Revenue: Key Insights for Old Dominion Freight Line, Inc. and AECOM
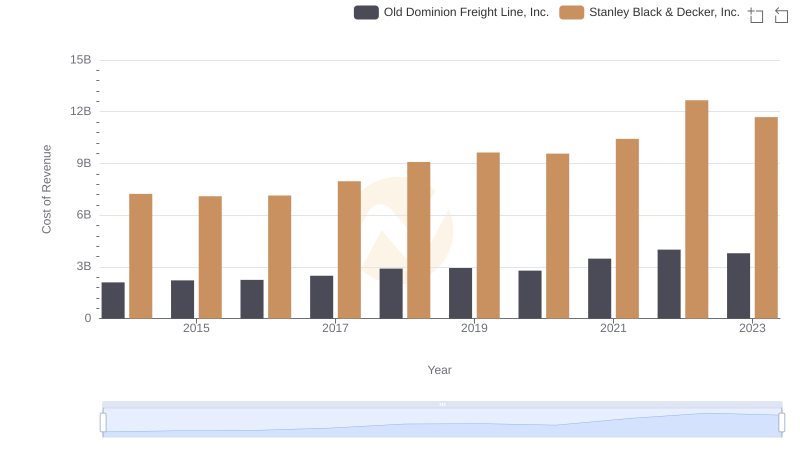
Cost Insights: Breaking Down Old Dominion Freight Line, Inc. and Stanley Black & Decker, Inc.'s Expenses
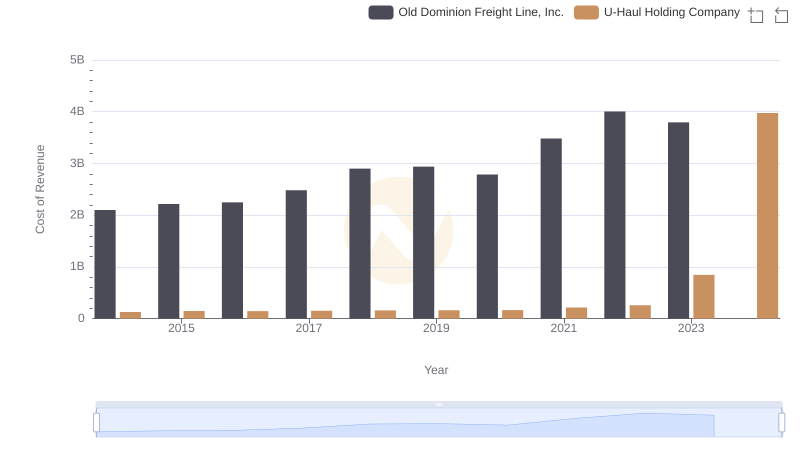
Cost of Revenue Trends: Old Dominion Freight Line, Inc. vs U-Haul Holding Company
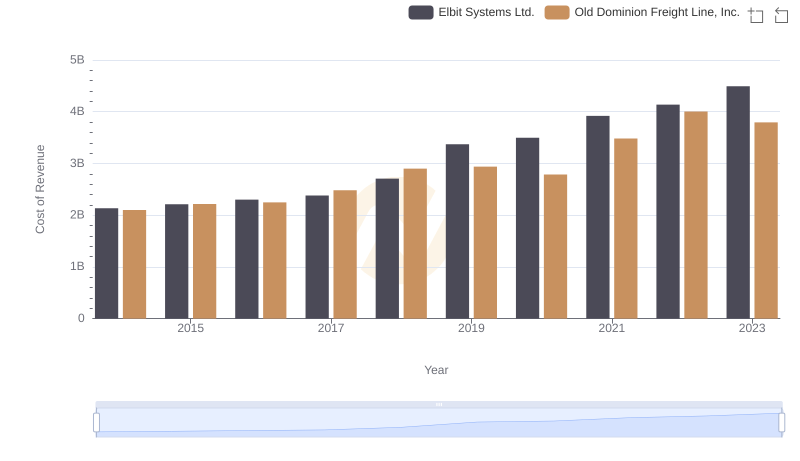
Analyzing Cost of Revenue: Old Dominion Freight Line, Inc. and Elbit Systems Ltd.
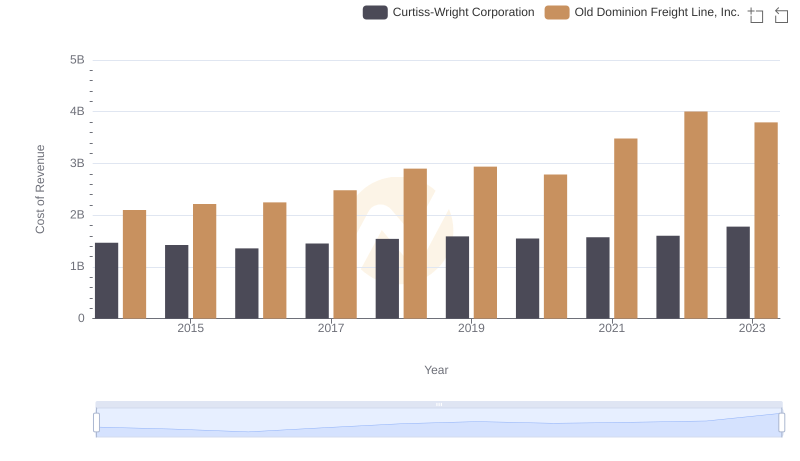
Cost of Revenue: Key Insights for Old Dominion Freight Line, Inc. and Curtiss-Wright Corporation
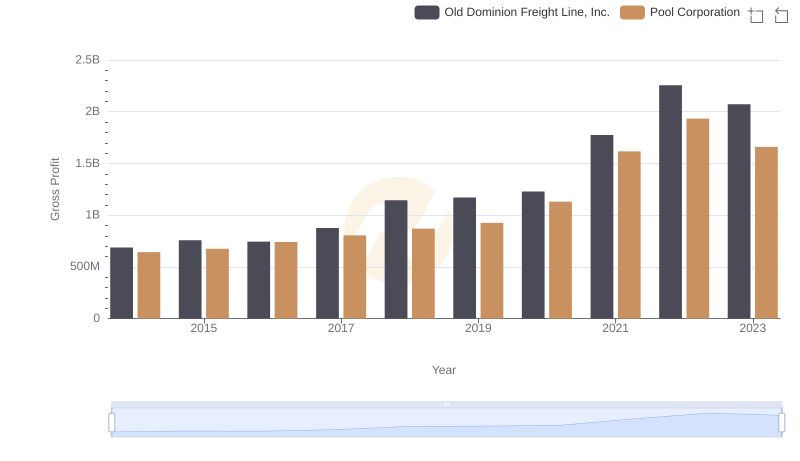
Old Dominion Freight Line, Inc. vs Pool Corporation: A Gross Profit Performance Breakdown
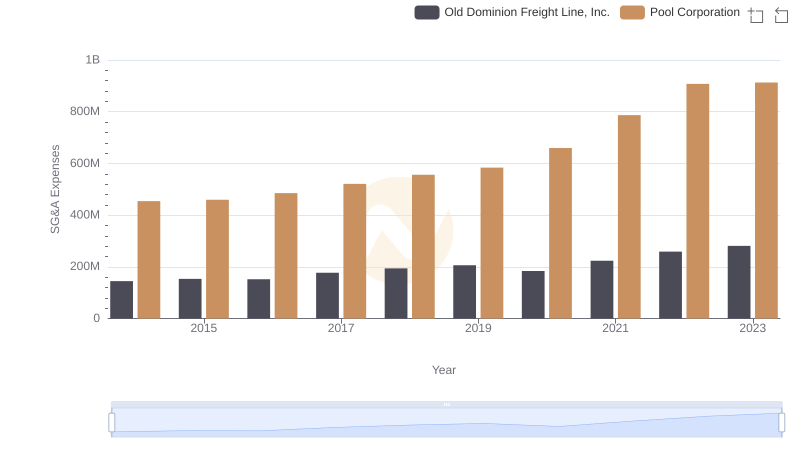
Operational Costs Compared: SG&A Analysis of Old Dominion Freight Line, Inc. and Pool Corporation