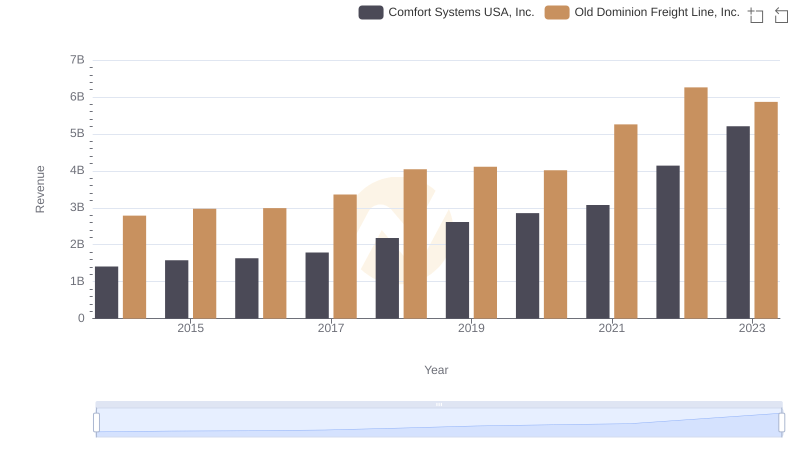
| __timestamp | Comfort Systems USA, Inc. | Old Dominion Freight Line, Inc. |
|---|---|---|
| Wednesday, January 1, 2014 | 1161024000 | 2100409000 |
| Thursday, January 1, 2015 | 1262390000 | 2214943000 |
| Friday, January 1, 2016 | 1290331000 | 2246890000 |
| Sunday, January 1, 2017 | 1421641000 | 2482732000 |
| Monday, January 1, 2018 | 1736600000 | 2899452000 |
| Tuesday, January 1, 2019 | 2113334000 | 2938895000 |
| Wednesday, January 1, 2020 | 2309676000 | 2786531000 |
| Friday, January 1, 2021 | 2510429000 | 3481268000 |
| Saturday, January 1, 2022 | 3398756000 | 4003951000 |
| Sunday, January 1, 2023 | 4216251000 | 3793953000 |
Cracking the code
In the ever-evolving landscape of the American economy, understanding the financial health of companies is paramount. Among the myriad of metrics available, the cost of revenue stands out as a critical indicator of operational efficiency and profitability. This article delves into the cost of revenue for two prominent players in their respective industries: Old Dominion Freight Line, Inc. (ODFL) and Comfort Systems USA, Inc. (FIX).
Old Dominion Freight Line, founded in 1934, has established itself as a leader in the less-than-truckload (LTL) shipping sector. Over the years, the company has demonstrated robust growth, driven by a commitment to service excellence and operational efficiency. Conversely, Comfort Systems USA, a prominent player in the HVAC and plumbing services industry, has also shown significant growth since its inception in 1997, fueled by a series of strategic acquisitions and a focus on customer satisfaction.
From 2014 to 2023, both companies exhibited notable trends in their cost of revenue. Old Dominion Freight Line's cost of revenue has increased steadily, reflecting a growth rate of approximately 80% over the decade. In 2014, the cost was around $2.1 billion, escalating to nearly $3.8 billion by 2023. This upward trajectory underscores the company's expansion and increased operational demands.
In contrast, Comfort Systems USA experienced an even more dramatic rise in its cost of revenue, which surged from about $1.2 billion in 2014 to over $4.2 billion in 2023, marking an increase of over 250%. This substantial growth can be attributed to the company’s aggressive expansion strategy and the rising demand for HVAC services, particularly in a post-pandemic world where indoor climate control has become a priority.
When we juxtapose the two companies, Old Dominion's cost of revenue has consistently remained higher than that of Comfort Systems USA, albeit with a more moderate growth rate. In 2022, for instance, Old Dominion reported a cost of revenue of approximately $4 billion, while Comfort Systems reached around $3.4 billion. This indicates that while Comfort Systems is growing rapidly, Old Dominion still commands a larger share of revenue costs in the freight sector.
The ratio of cost of revenue to total revenue is another vital metric to consider. Old Dominion Freight Line maintains a lower ratio, reflecting its operational efficiency, while Comfort Systems, with its higher growth rate, shows a slightly elevated ratio, indicating that its rapid expansion may come with increased operational costs.
As we move forward, both companies are poised for continued growth, albeit in different market conditions. Old Dominion Freight Line is likely to benefit from the ongoing e-commerce boom, while Comfort Systems USA will capitalize on the increasing focus on energy-efficient solutions and smart building technologies.
In conclusion, analyzing the cost of revenue for these two companies not only provides insights into their operational strategies but also highlights the broader economic trends shaping their industries. Stakeholders and investors should keep a keen eye on these metrics as they navigate the complexities of the market.
Breaking Down Revenue Trends: Old Dominion Freight Line, Inc. vs Comfort Systems USA, Inc.
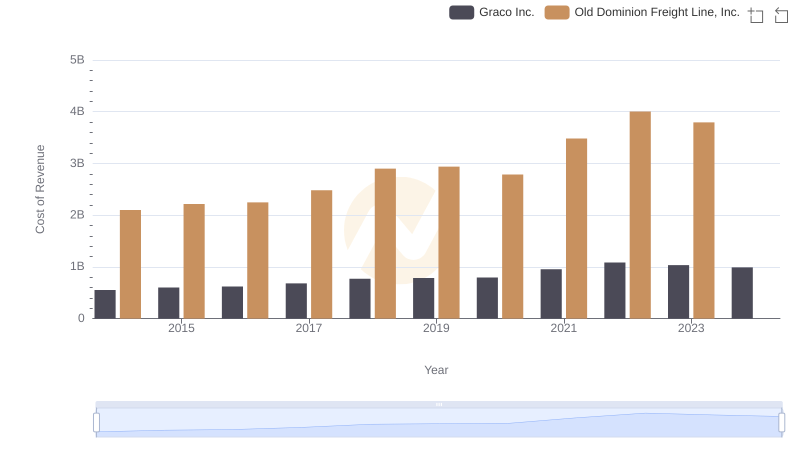
Cost of Revenue Comparison: Old Dominion Freight Line, Inc. vs Graco Inc.
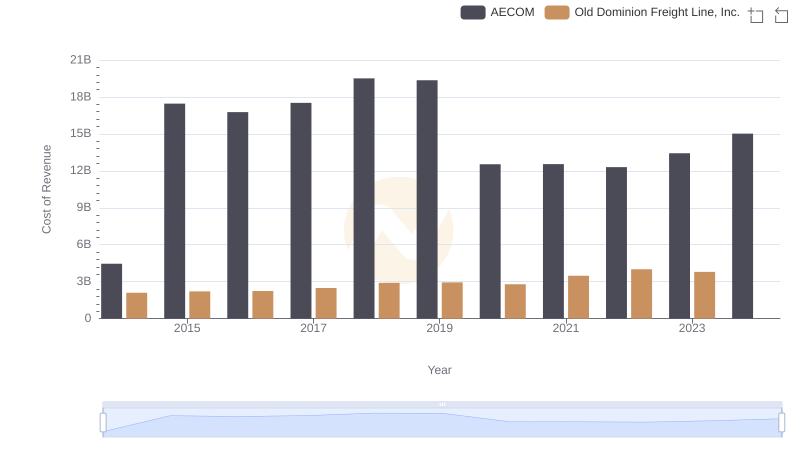
Cost of Revenue: Key Insights for Old Dominion Freight Line, Inc. and AECOM
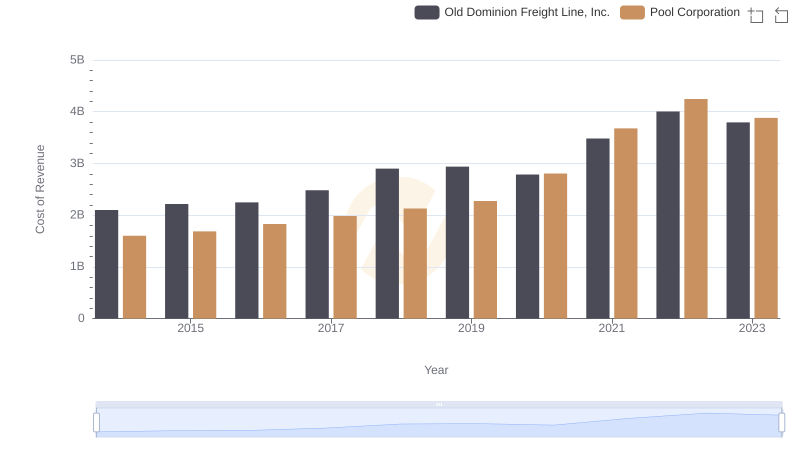
Cost of Revenue: Key Insights for Old Dominion Freight Line, Inc. and Pool Corporation
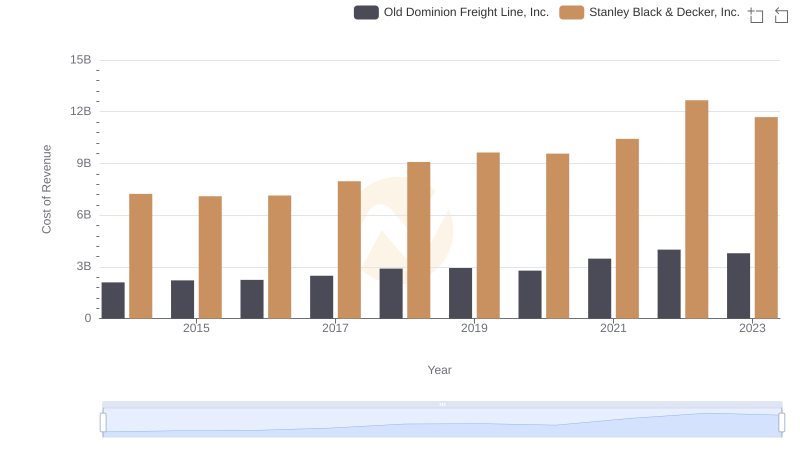
Cost Insights: Breaking Down Old Dominion Freight Line, Inc. and Stanley Black & Decker, Inc.'s Expenses
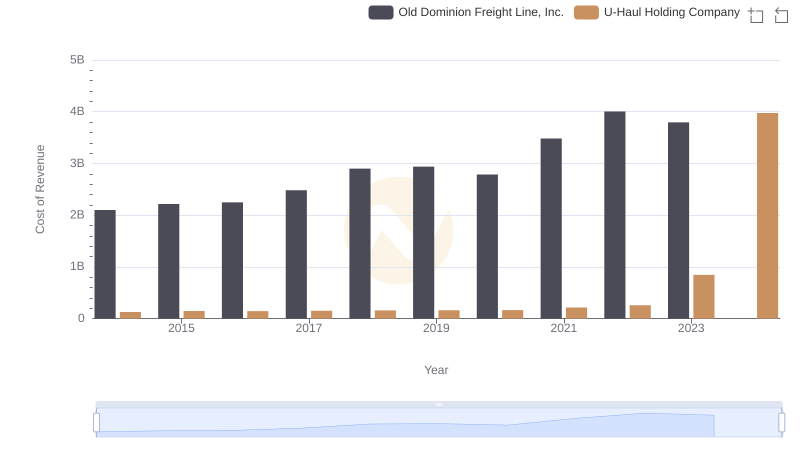
Cost of Revenue Trends: Old Dominion Freight Line, Inc. vs U-Haul Holding Company
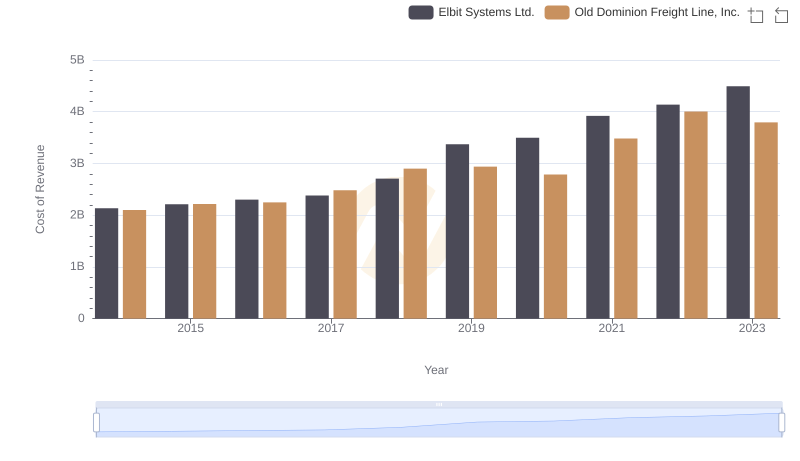
Analyzing Cost of Revenue: Old Dominion Freight Line, Inc. and Elbit Systems Ltd.
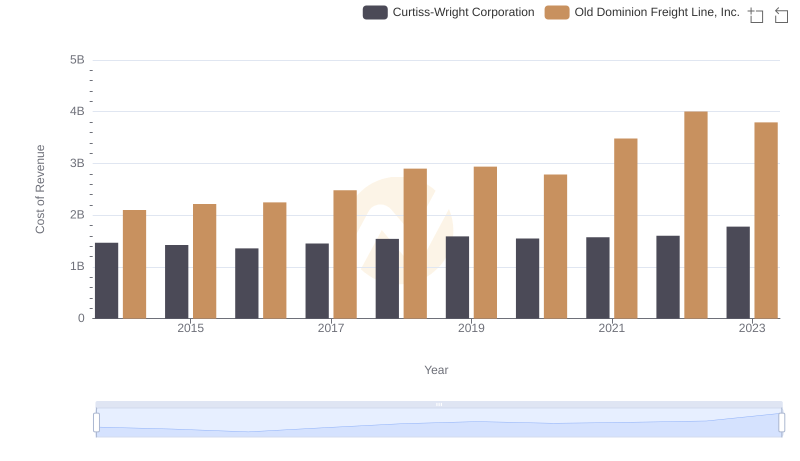
Cost of Revenue: Key Insights for Old Dominion Freight Line, Inc. and Curtiss-Wright Corporation
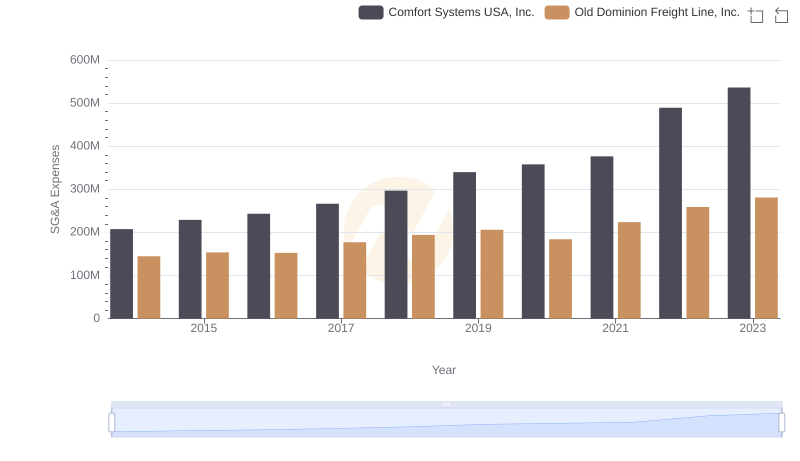
Comparing SG&A Expenses: Old Dominion Freight Line, Inc. vs Comfort Systems USA, Inc. Trends and Insights
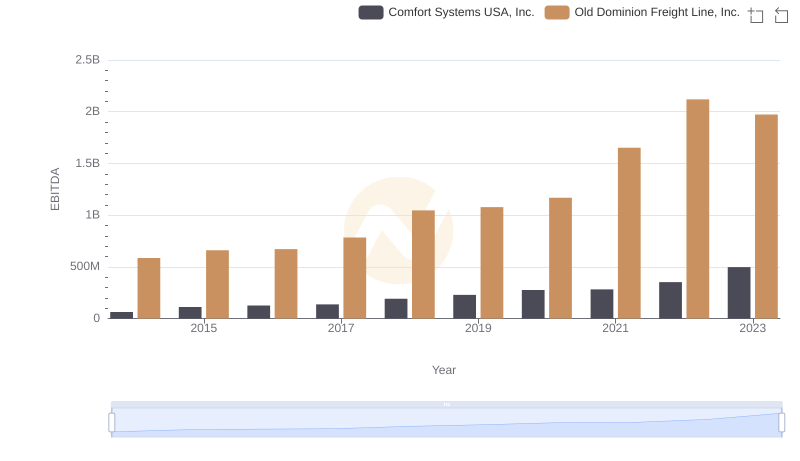
Professional EBITDA Benchmarking: Old Dominion Freight Line, Inc. vs Comfort Systems USA, Inc.