| __timestamp | AECOM | Old Dominion Freight Line, Inc. |
|---|---|---|
| Wednesday, January 1, 2014 | 4452451000 | 2100409000 |
| Thursday, January 1, 2015 | 17454692000 | 2214943000 |
| Friday, January 1, 2016 | 16768001000 | 2246890000 |
| Sunday, January 1, 2017 | 17519682000 | 2482732000 |
| Monday, January 1, 2018 | 19504863000 | 2899452000 |
| Tuesday, January 1, 2019 | 19359884000 | 2938895000 |
| Wednesday, January 1, 2020 | 12530416000 | 2786531000 |
| Friday, January 1, 2021 | 12542431000 | 3481268000 |
| Saturday, January 1, 2022 | 12300208000 | 4003951000 |
| Sunday, January 1, 2023 | 13432996000 | 3793953000 |
| Monday, January 1, 2024 | 15021157000 |
Unveiling the hidden dimensions of data
In the world of logistics and infrastructure, Old Dominion Freight Line, Inc. and AECOM stand as titans. Over the past decade, AECOM's cost of revenue has shown a remarkable growth trajectory, peaking in 2018 with a 338% increase from 2014. However, the pandemic year of 2020 saw a dip, with costs dropping by 36% from the previous year. In contrast, Old Dominion Freight Line, Inc. has maintained a steady climb, with a 90% increase in cost of revenue from 2014 to 2022, reflecting its robust operational efficiency. Notably, 2023 data for Old Dominion is missing, leaving a gap in the narrative. This comparison highlights the dynamic nature of cost management in these industries, offering insights into their strategic priorities and market adaptability.
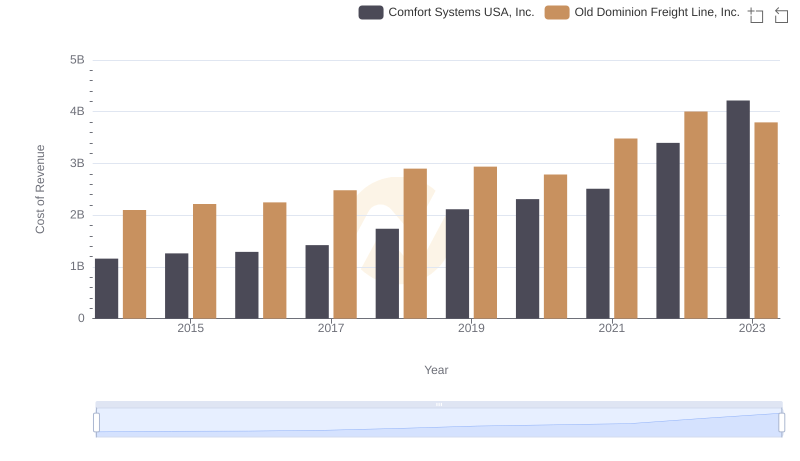
Analyzing Cost of Revenue: Old Dominion Freight Line, Inc. and Comfort Systems USA, Inc.
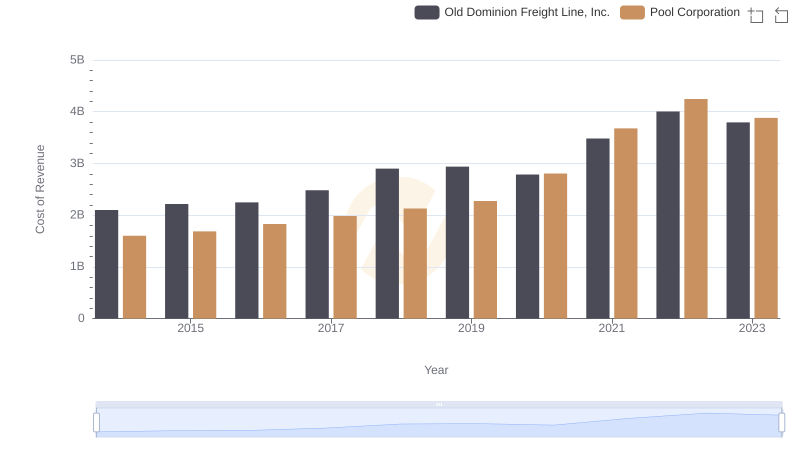
Cost of Revenue: Key Insights for Old Dominion Freight Line, Inc. and Pool Corporation
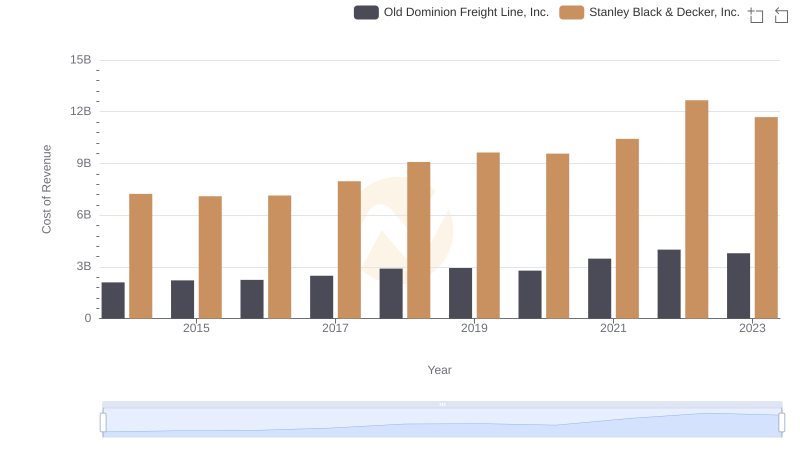
Cost Insights: Breaking Down Old Dominion Freight Line, Inc. and Stanley Black & Decker, Inc.'s Expenses
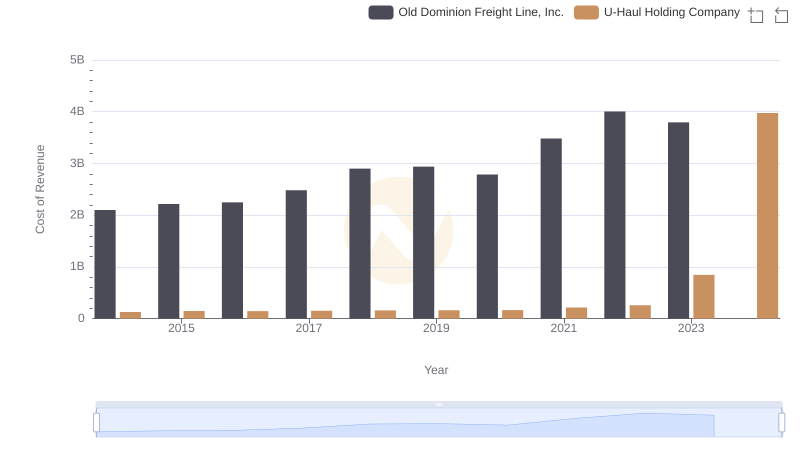
Cost of Revenue Trends: Old Dominion Freight Line, Inc. vs U-Haul Holding Company
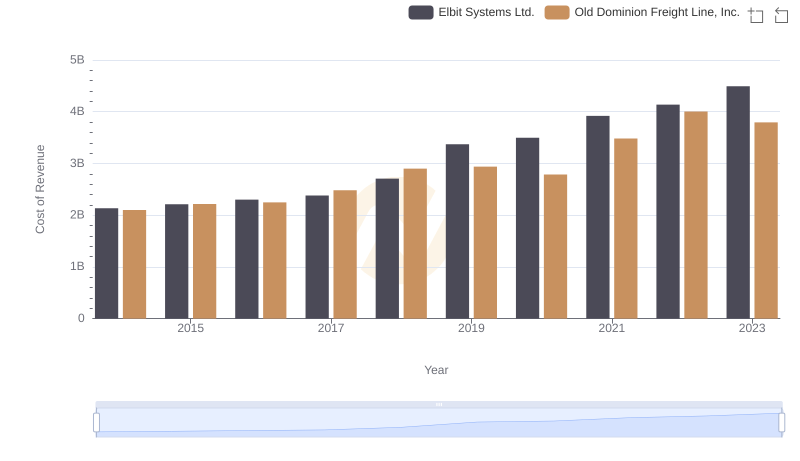
Analyzing Cost of Revenue: Old Dominion Freight Line, Inc. and Elbit Systems Ltd.
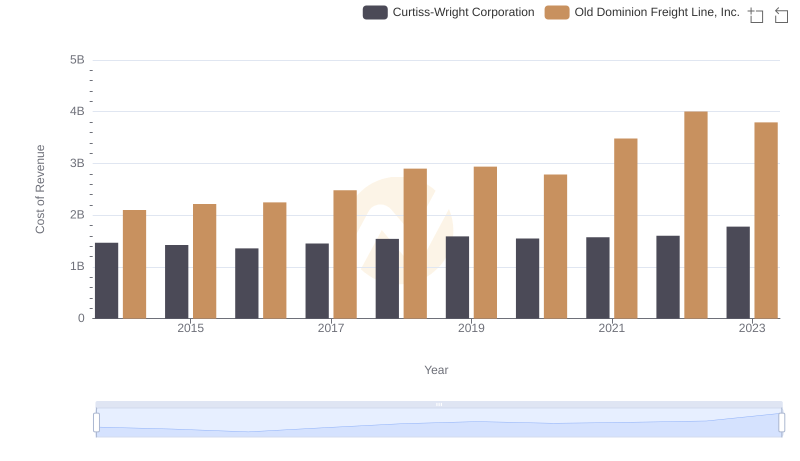
Cost of Revenue: Key Insights for Old Dominion Freight Line, Inc. and Curtiss-Wright Corporation
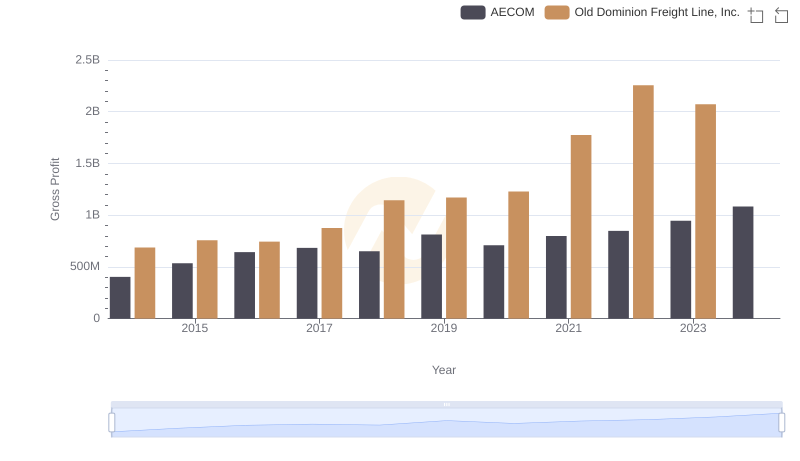
Gross Profit Analysis: Comparing Old Dominion Freight Line, Inc. and AECOM
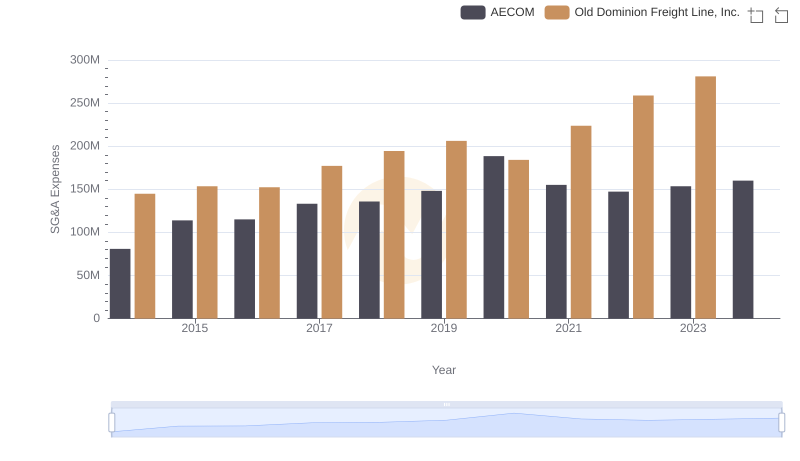
Comparing SG&A Expenses: Old Dominion Freight Line, Inc. vs AECOM Trends and Insights
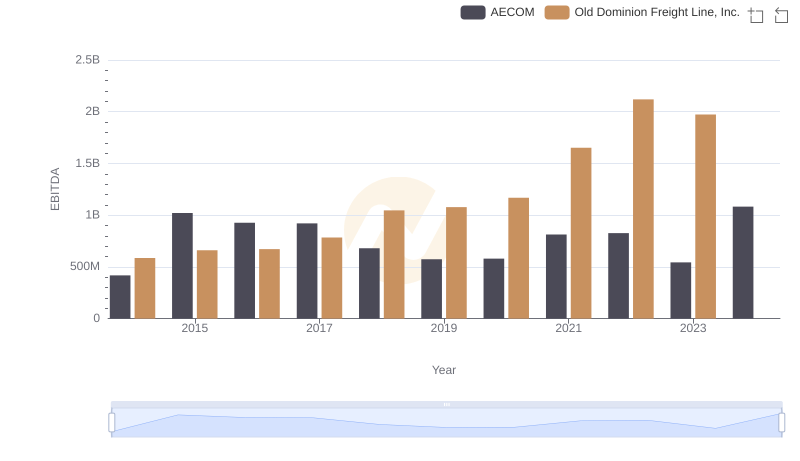
Old Dominion Freight Line, Inc. and AECOM: A Detailed Examination of EBITDA Performance