| __timestamp | Old Dominion Freight Line, Inc. | Pool Corporation |
|---|---|---|
| Wednesday, January 1, 2014 | 2787897000 | 2246562000 |
| Thursday, January 1, 2015 | 2972442000 | 2363139000 |
| Friday, January 1, 2016 | 2991517000 | 2570803000 |
| Sunday, January 1, 2017 | 3358112000 | 2788188000 |
| Monday, January 1, 2018 | 4043695000 | 2998097000 |
| Tuesday, January 1, 2019 | 4109111000 | 3199517000 |
| Wednesday, January 1, 2020 | 4015129000 | 3936623000 |
| Friday, January 1, 2021 | 5256328000 | 5295584000 |
| Saturday, January 1, 2022 | 6260077000 | 6179727000 |
| Sunday, January 1, 2023 | 5866152000 | 5541595000 |
Infusing magic into the data realm
In the competitive landscape of logistics and distribution, Old Dominion Freight Line, Inc. and Pool Corporation have showcased remarkable revenue growth over the past decade. From 2014 to 2023, Old Dominion Freight Line, Inc. saw its revenue surge by approximately 110%, peaking in 2022. Meanwhile, Pool Corporation experienced a similar upward trajectory, with a 175% increase, also reaching its zenith in 2022.
Both companies demonstrated resilience, particularly during the challenging economic climate of 2020. Old Dominion Freight Line, Inc. maintained steady growth, while Pool Corporation's revenue jumped by 23% from 2019 to 2020. By 2023, both companies experienced a slight dip, yet their revenues remained significantly higher than in 2014. This data underscores the robust nature of these industry leaders, adapting and thriving amidst changing market dynamics.
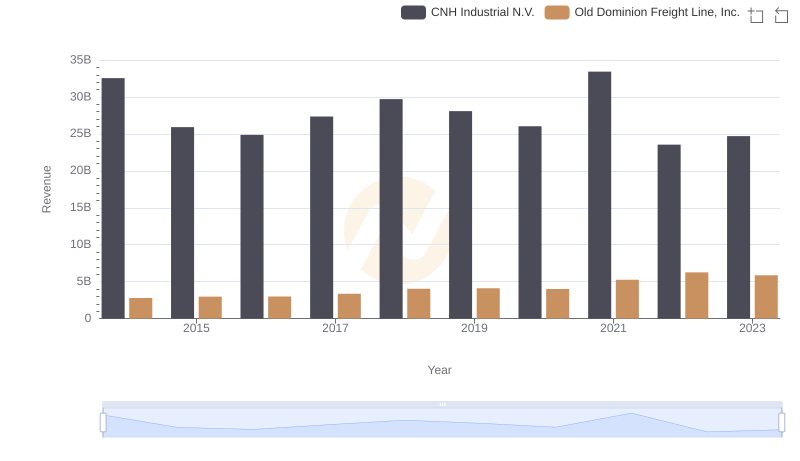
Comparing Revenue Performance: Old Dominion Freight Line, Inc. or CNH Industrial N.V.?
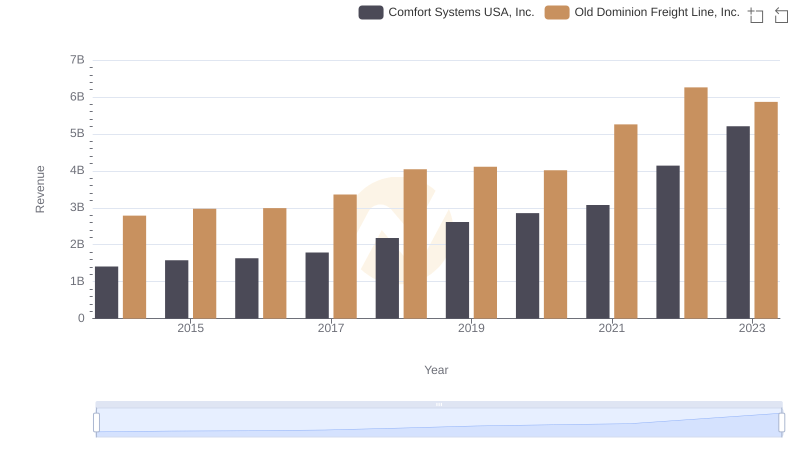
Breaking Down Revenue Trends: Old Dominion Freight Line, Inc. vs Comfort Systems USA, Inc.
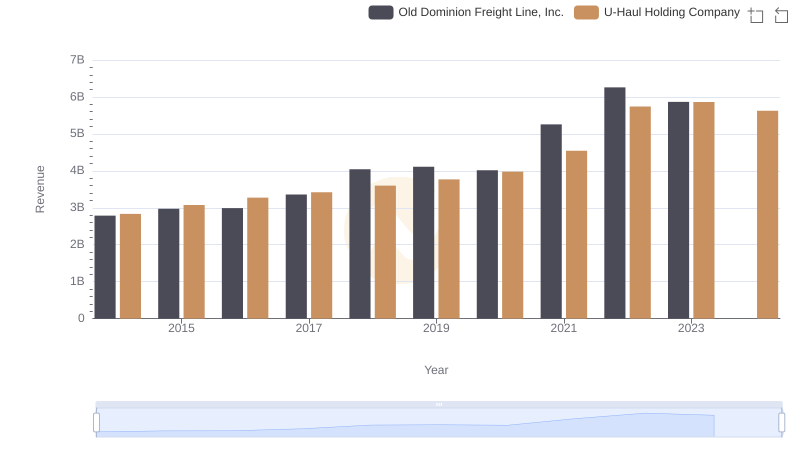
Old Dominion Freight Line, Inc. or U-Haul Holding Company: Who Leads in Yearly Revenue?
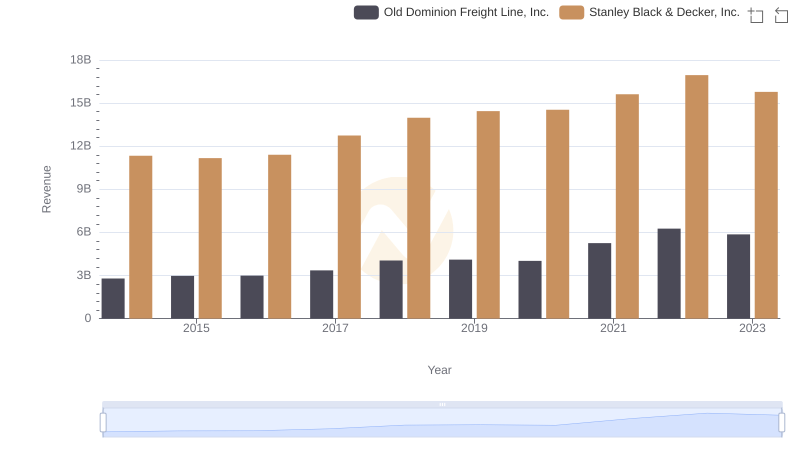
Old Dominion Freight Line, Inc. vs Stanley Black & Decker, Inc.: Annual Revenue Growth Compared
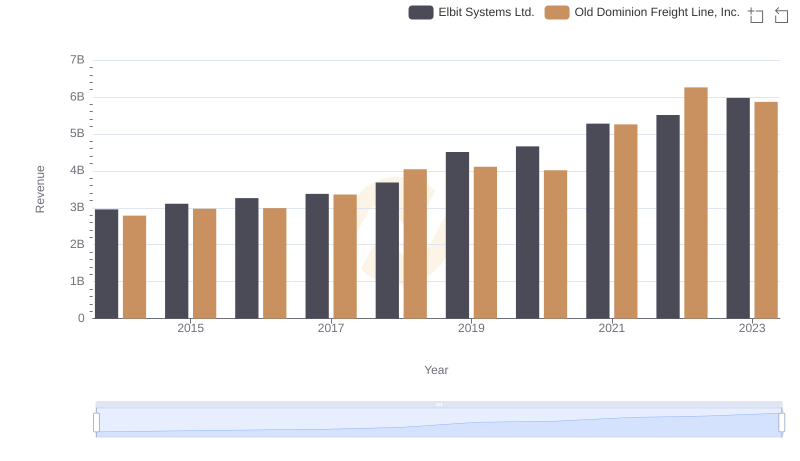
Old Dominion Freight Line, Inc. vs Elbit Systems Ltd.: Annual Revenue Growth Compared
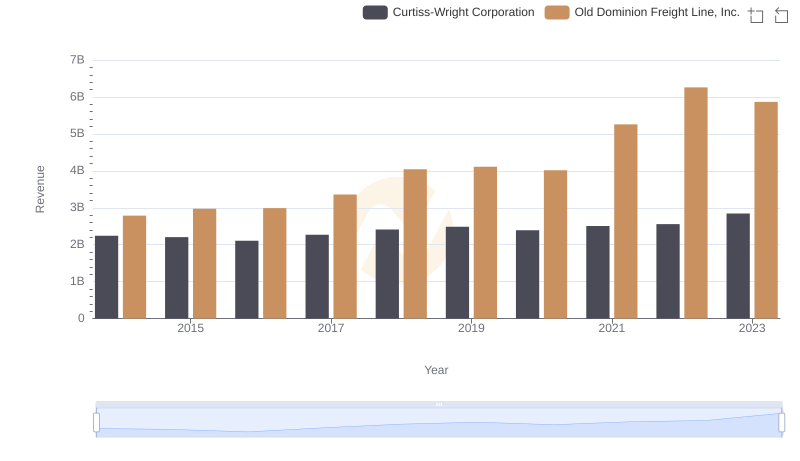
Annual Revenue Comparison: Old Dominion Freight Line, Inc. vs Curtiss-Wright Corporation
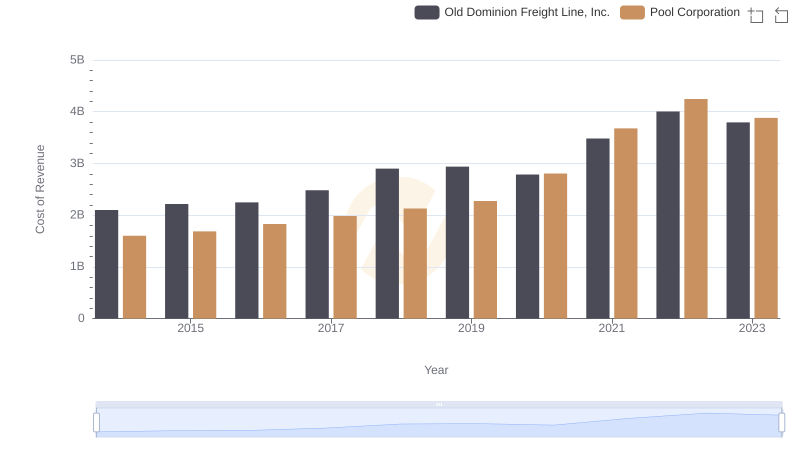
Cost of Revenue: Key Insights for Old Dominion Freight Line, Inc. and Pool Corporation
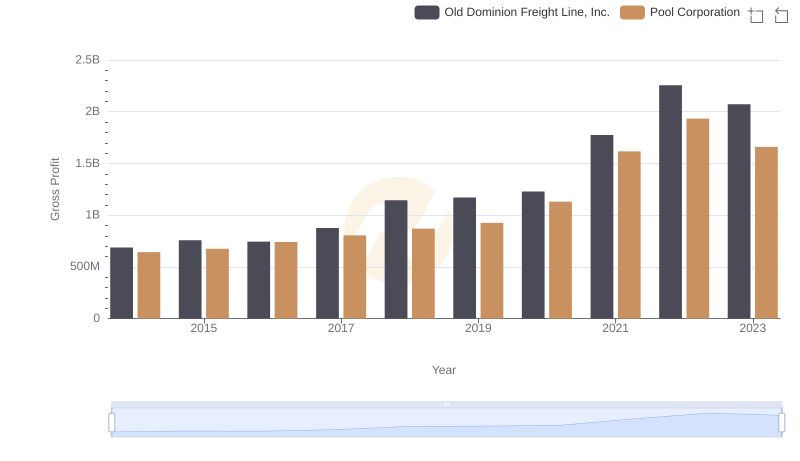
Old Dominion Freight Line, Inc. vs Pool Corporation: A Gross Profit Performance Breakdown
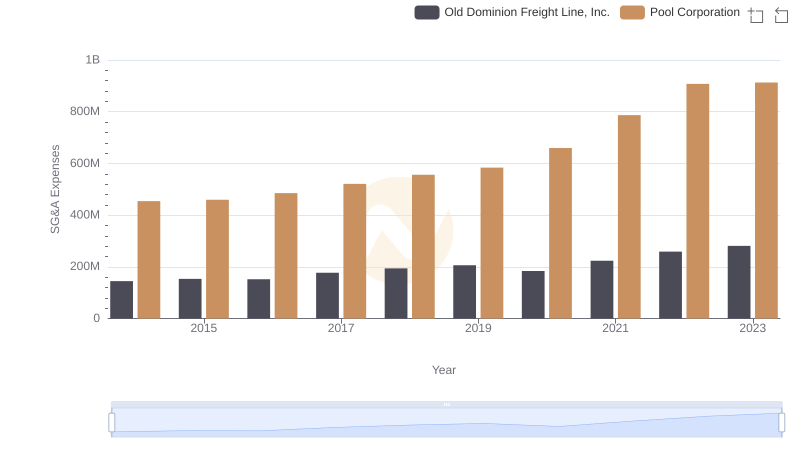
Operational Costs Compared: SG&A Analysis of Old Dominion Freight Line, Inc. and Pool Corporation