| __timestamp | Elbit Systems Ltd. | Old Dominion Freight Line, Inc. |
|---|---|---|
| Wednesday, January 1, 2014 | 2133151000 | 2100409000 |
| Thursday, January 1, 2015 | 2210528000 | 2214943000 |
| Friday, January 1, 2016 | 2300636000 | 2246890000 |
| Sunday, January 1, 2017 | 2379905000 | 2482732000 |
| Monday, January 1, 2018 | 2707505000 | 2899452000 |
| Tuesday, January 1, 2019 | 3371933000 | 2938895000 |
| Wednesday, January 1, 2020 | 3497465000 | 2786531000 |
| Friday, January 1, 2021 | 3920473000 | 3481268000 |
| Saturday, January 1, 2022 | 4138266000 | 4003951000 |
| Sunday, January 1, 2023 | 4491790000 | 3793953000 |
Igniting the spark of knowledge
In the ever-evolving landscape of global commerce, understanding the cost of revenue is crucial for evaluating a company's financial health. This analysis delves into the cost of revenue trends for two industry titans: Old Dominion Freight Line, Inc. and Elbit Systems Ltd., from 2014 to 2023.
Over the past decade, Elbit Systems Ltd. has seen a steady increase in its cost of revenue, rising by approximately 110% from 2014 to 2023. This growth reflects the company's expanding operations and market reach. In contrast, Old Dominion Freight Line, Inc. experienced a more moderate increase of around 80% during the same period, highlighting its strategic cost management.
While both companies have shown growth, Elbit Systems Ltd. consistently outpaces Old Dominion in cost of revenue, indicating a more aggressive expansion strategy. This data provides valuable insights for investors and analysts seeking to understand the financial dynamics of these industry leaders.
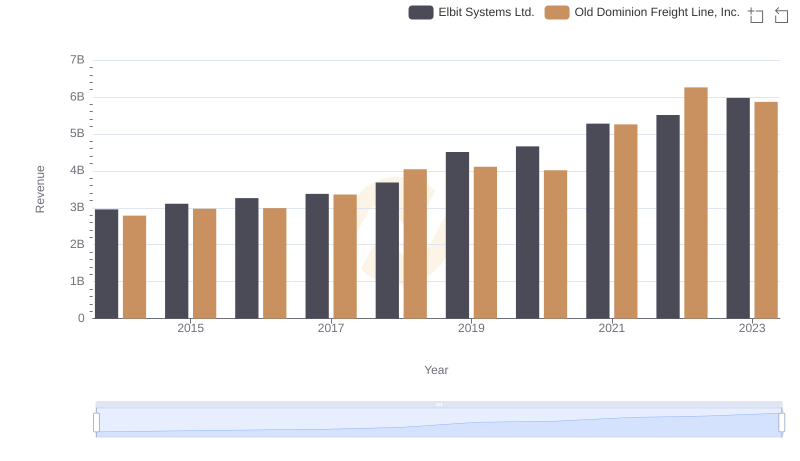
Old Dominion Freight Line, Inc. vs Elbit Systems Ltd.: Annual Revenue Growth Compared
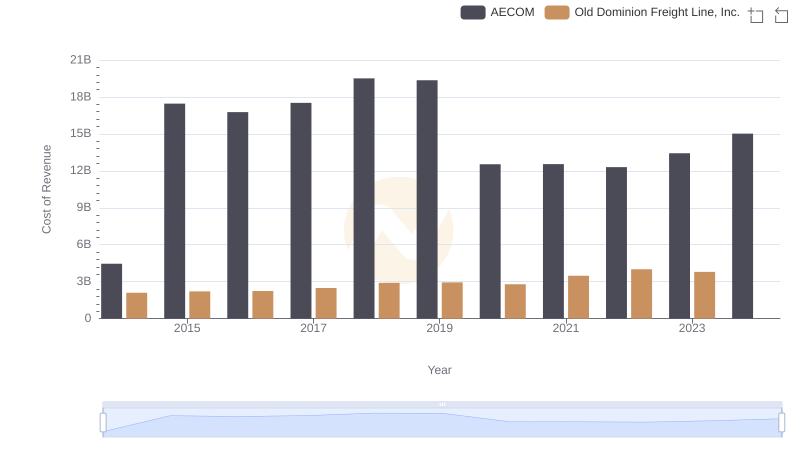
Cost of Revenue: Key Insights for Old Dominion Freight Line, Inc. and AECOM
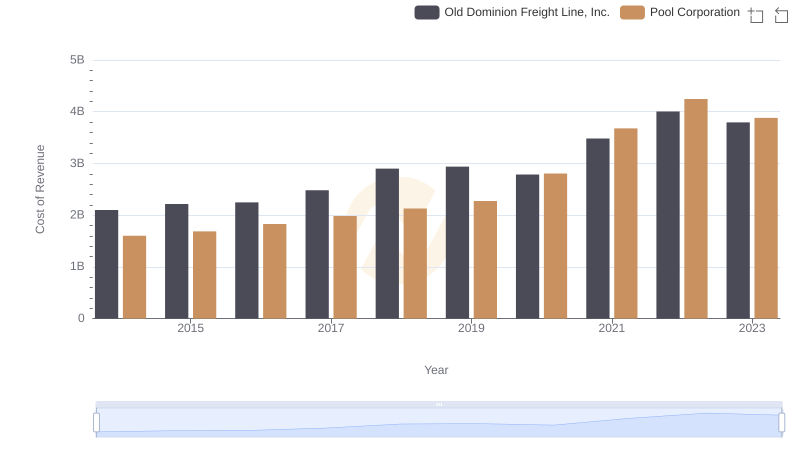
Cost of Revenue: Key Insights for Old Dominion Freight Line, Inc. and Pool Corporation
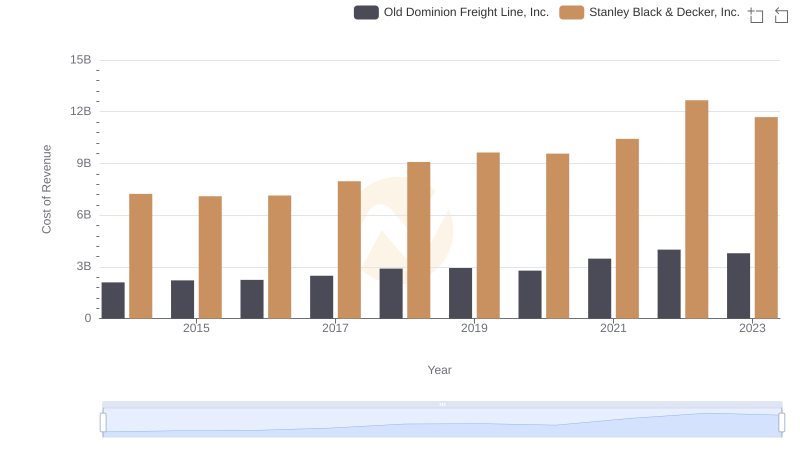
Cost Insights: Breaking Down Old Dominion Freight Line, Inc. and Stanley Black & Decker, Inc.'s Expenses
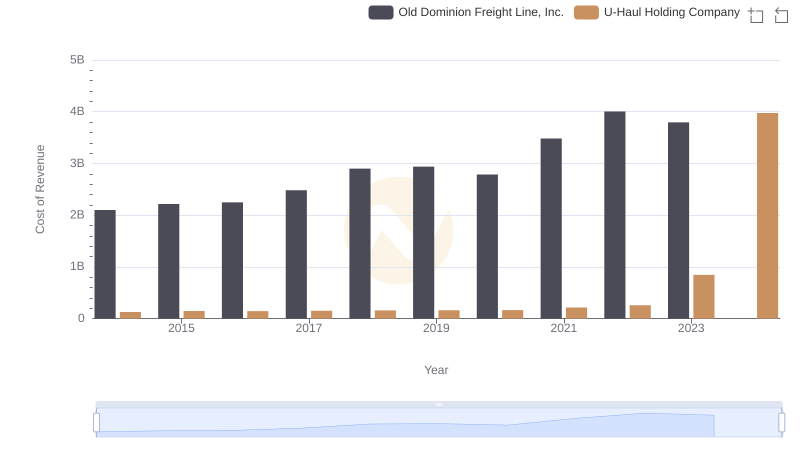
Cost of Revenue Trends: Old Dominion Freight Line, Inc. vs U-Haul Holding Company
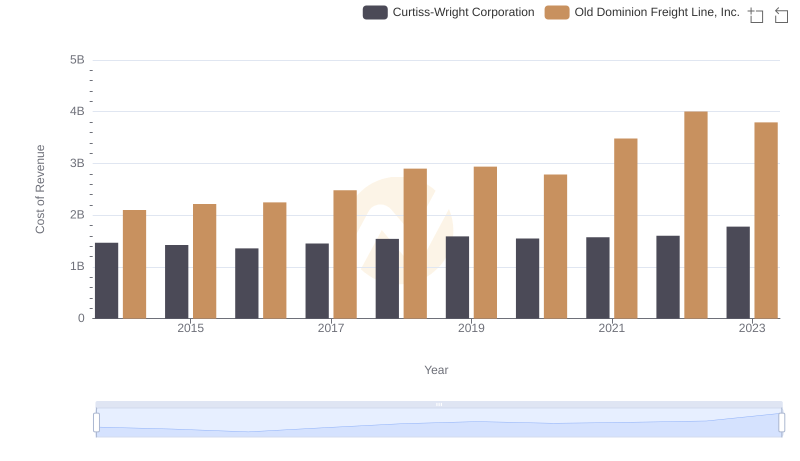
Cost of Revenue: Key Insights for Old Dominion Freight Line, Inc. and Curtiss-Wright Corporation
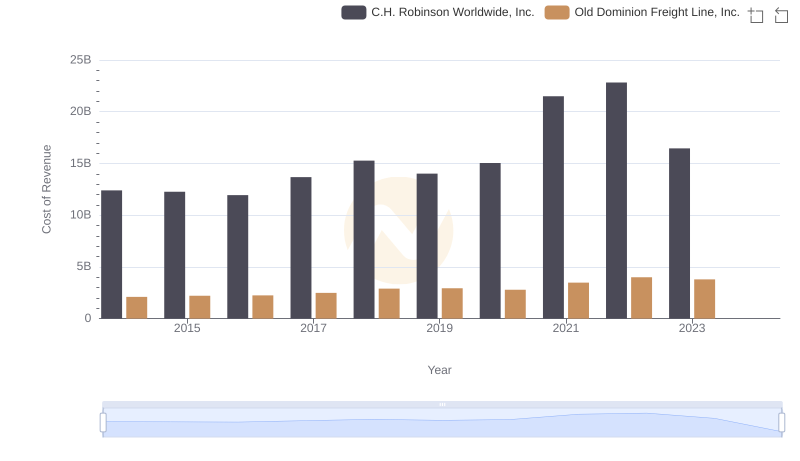
Comparing Cost of Revenue Efficiency: Old Dominion Freight Line, Inc. vs C.H. Robinson Worldwide, Inc.
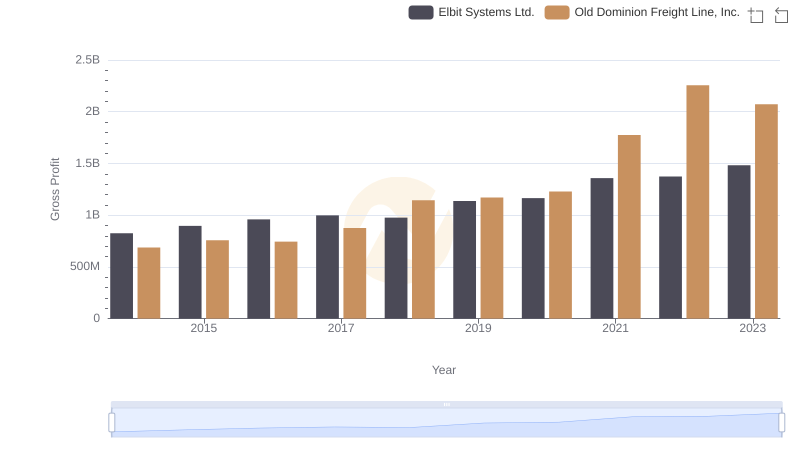
Gross Profit Trends Compared: Old Dominion Freight Line, Inc. vs Elbit Systems Ltd.
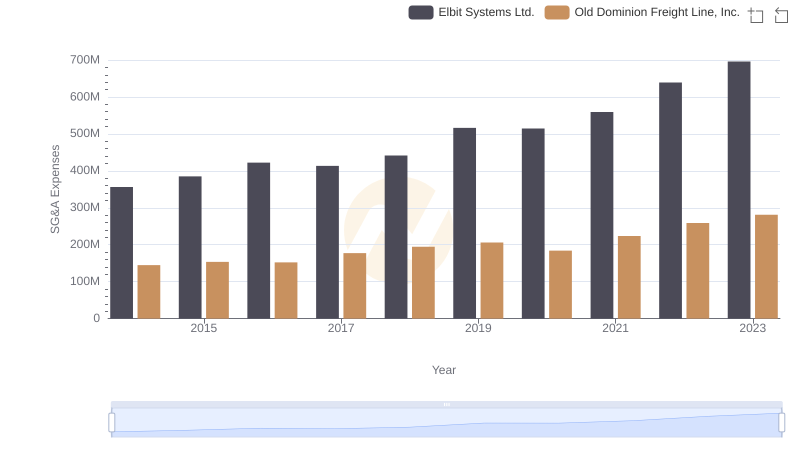
Cost Management Insights: SG&A Expenses for Old Dominion Freight Line, Inc. and Elbit Systems Ltd.
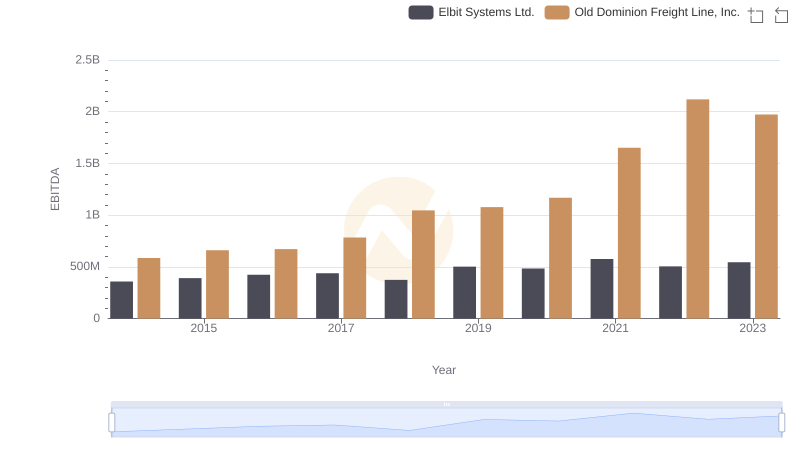
Comparative EBITDA Analysis: Old Dominion Freight Line, Inc. vs Elbit Systems Ltd.