| __timestamp | Old Dominion Freight Line, Inc. | Stanley Black & Decker, Inc. |
|---|---|---|
| Wednesday, January 1, 2014 | 2100409000 | 7235900000 |
| Thursday, January 1, 2015 | 2214943000 | 7099800000 |
| Friday, January 1, 2016 | 2246890000 | 7139700000 |
| Sunday, January 1, 2017 | 2482732000 | 7969200000 |
| Monday, January 1, 2018 | 2899452000 | 9080500000 |
| Tuesday, January 1, 2019 | 2938895000 | 9636700000 |
| Wednesday, January 1, 2020 | 2786531000 | 9566700000 |
| Friday, January 1, 2021 | 3481268000 | 10423000000 |
| Saturday, January 1, 2022 | 4003951000 | 12663300000 |
| Sunday, January 1, 2023 | 3793953000 | 11683100000 |
| Monday, January 1, 2024 | 10851300000 |
Unlocking the unknown
In the ever-evolving landscape of corporate finance, understanding cost structures is pivotal. Old Dominion Freight Line, Inc. and Stanley Black & Decker, Inc. offer intriguing insights into how two distinct industries manage their expenses. From 2014 to 2023, Old Dominion's cost of revenue grew by approximately 80%, reflecting its strategic expansion in the freight industry. Meanwhile, Stanley Black & Decker's costs surged by around 60%, underscoring its robust presence in the tools and storage sector.
This comparative analysis not only sheds light on their financial strategies but also offers a window into broader industry trends.
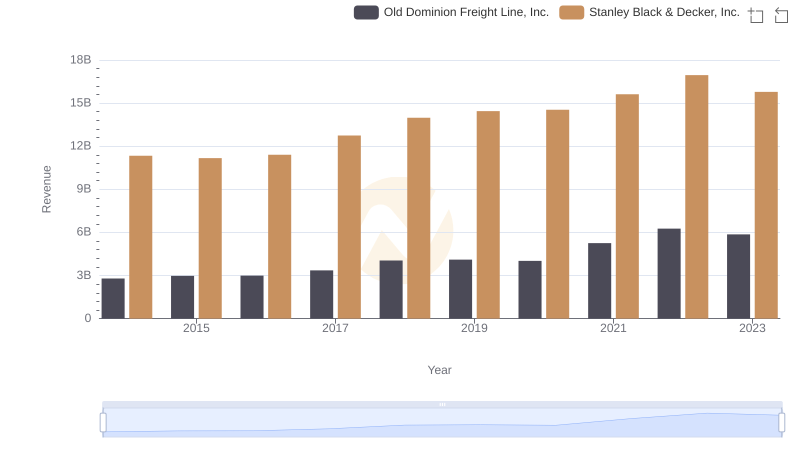
Comparing Revenue Performance: Old Dominion Freight Line, Inc. or Stanley Black & Decker, Inc.?
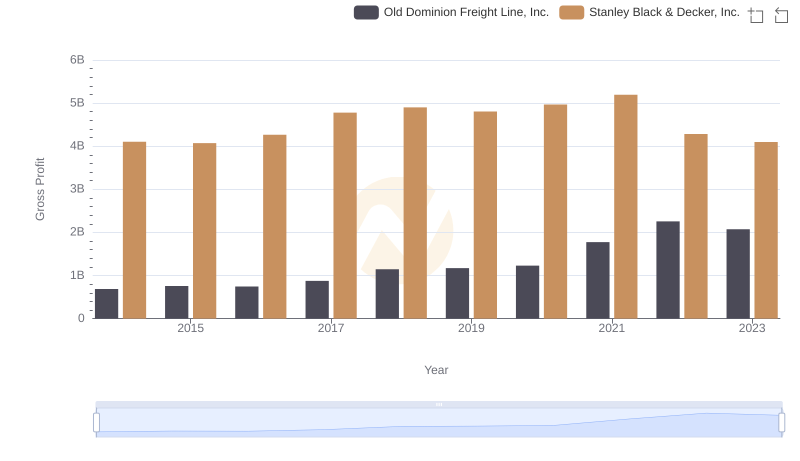
Gross Profit Comparison: Old Dominion Freight Line, Inc. and Stanley Black & Decker, Inc. Trends
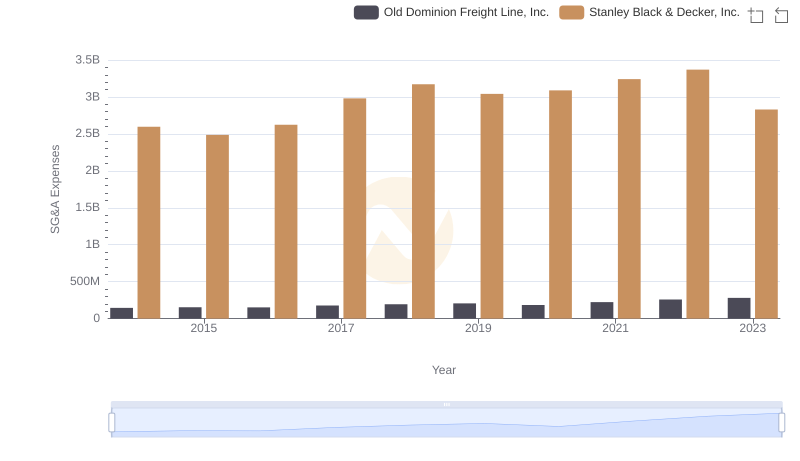
Old Dominion Freight Line, Inc. or Stanley Black & Decker, Inc.: Who Manages SG&A Costs Better?

Old Dominion Freight Line, Inc. vs Stanley Black & Decker, Inc.: In-Depth EBITDA Performance Comparison
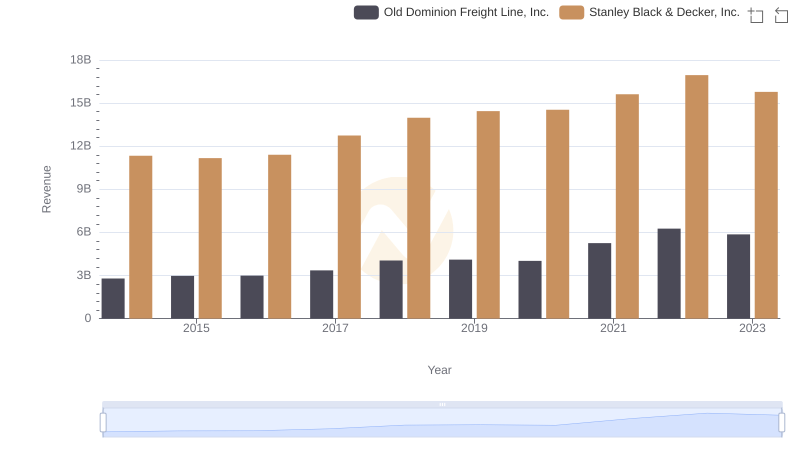
Old Dominion Freight Line, Inc. vs Stanley Black & Decker, Inc.: Annual Revenue Growth Compared
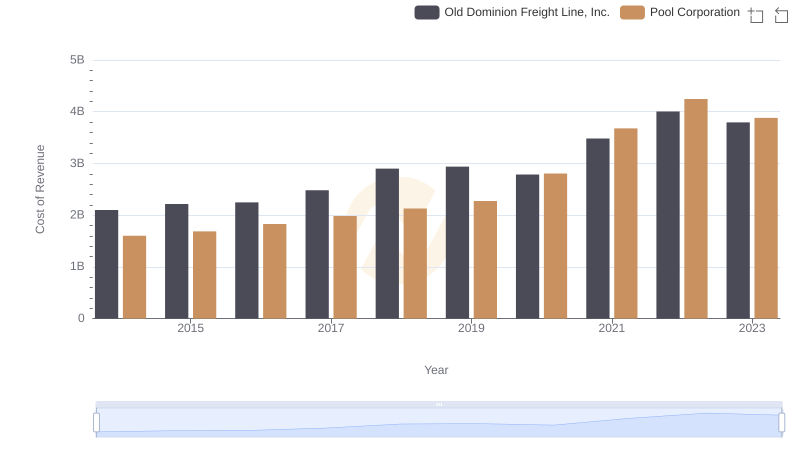
Cost of Revenue: Key Insights for Old Dominion Freight Line, Inc. and Pool Corporation
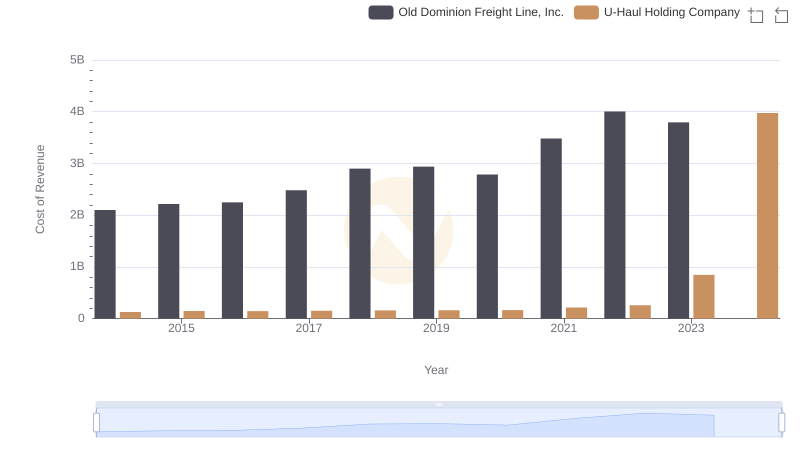
Cost of Revenue Trends: Old Dominion Freight Line, Inc. vs U-Haul Holding Company
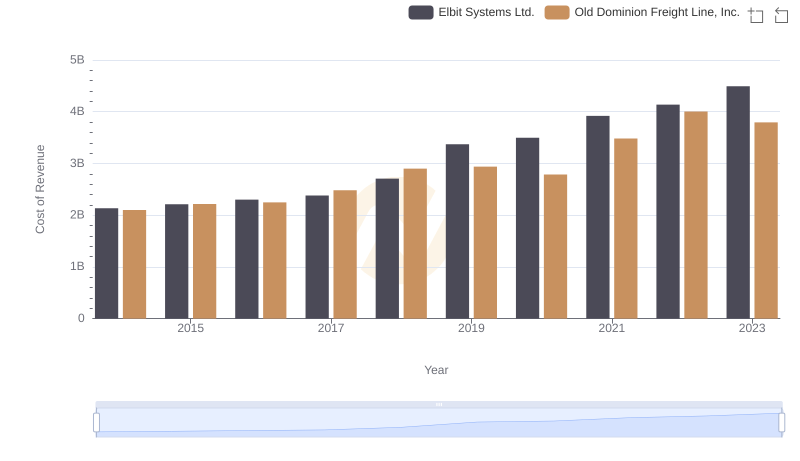
Analyzing Cost of Revenue: Old Dominion Freight Line, Inc. and Elbit Systems Ltd.

SG&A Efficiency Analysis: Comparing Old Dominion Freight Line, Inc. and Stanley Black & Decker, Inc.
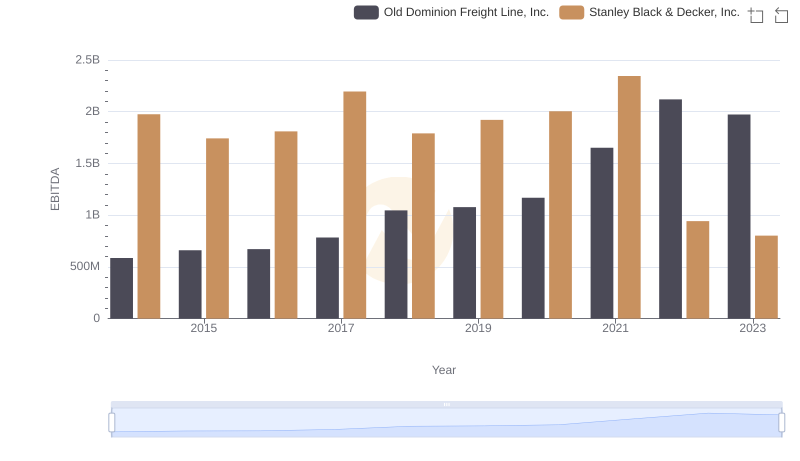
A Professional Review of EBITDA: Old Dominion Freight Line, Inc. Compared to Stanley Black & Decker, Inc.