| __timestamp | Old Dominion Freight Line, Inc. | Pool Corporation |
|---|---|---|
| Wednesday, January 1, 2014 | 687488000 | 643340000 |
| Thursday, January 1, 2015 | 757499000 | 675644000 |
| Friday, January 1, 2016 | 744627000 | 741087000 |
| Sunday, January 1, 2017 | 875380000 | 805289000 |
| Monday, January 1, 2018 | 1144243000 | 870173000 |
| Tuesday, January 1, 2019 | 1170216000 | 924925000 |
| Wednesday, January 1, 2020 | 1228598000 | 1130902000 |
| Friday, January 1, 2021 | 1775060000 | 1617092000 |
| Saturday, January 1, 2022 | 2256126000 | 1933412000 |
| Sunday, January 1, 2023 | 2072199000 | 1660044000 |
Data in motion
In the competitive landscape of logistics and supply chain management, Old Dominion Freight Line, Inc. and Pool Corporation have emerged as industry leaders. Over the past decade, from 2014 to 2023, both companies have demonstrated impressive growth in gross profit, reflecting their strategic prowess and market adaptability.
Old Dominion Freight Line, Inc. has seen its gross profit soar by approximately 202% from 2014 to 2022, peaking in 2022 before a slight dip in 2023. This growth trajectory underscores the company's robust operational efficiency and market expansion strategies. Meanwhile, Pool Corporation has also experienced a commendable increase of around 158% over the same period, highlighting its resilience and ability to capitalize on market opportunities.
This performance breakdown not only showcases the financial health of these companies but also provides valuable insights into the evolving dynamics of the logistics and supply chain sectors.
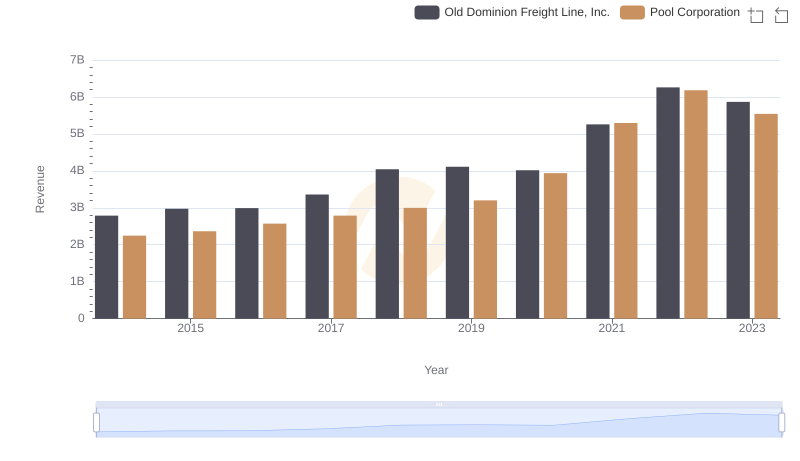
Breaking Down Revenue Trends: Old Dominion Freight Line, Inc. vs Pool Corporation
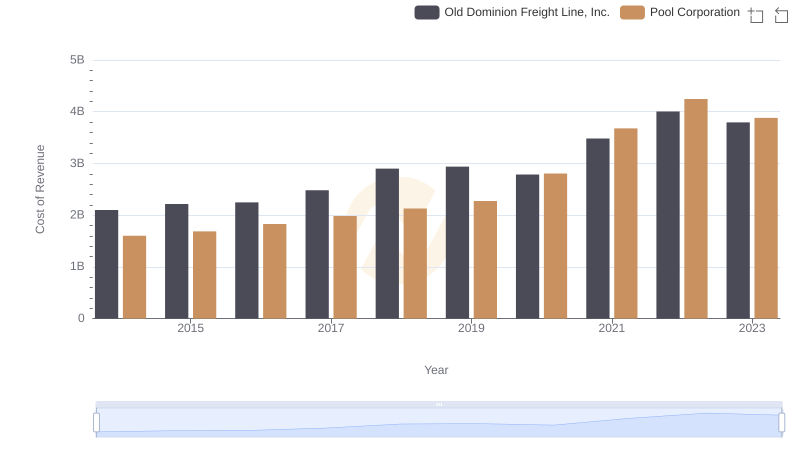
Cost of Revenue: Key Insights for Old Dominion Freight Line, Inc. and Pool Corporation
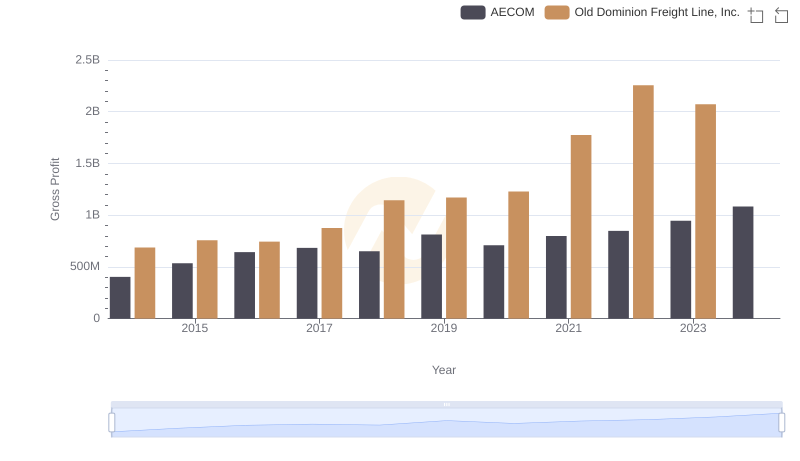
Gross Profit Analysis: Comparing Old Dominion Freight Line, Inc. and AECOM
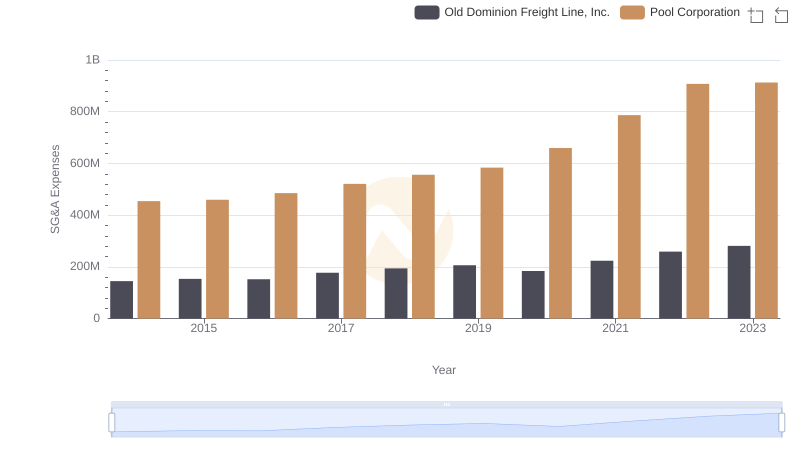
Operational Costs Compared: SG&A Analysis of Old Dominion Freight Line, Inc. and Pool Corporation
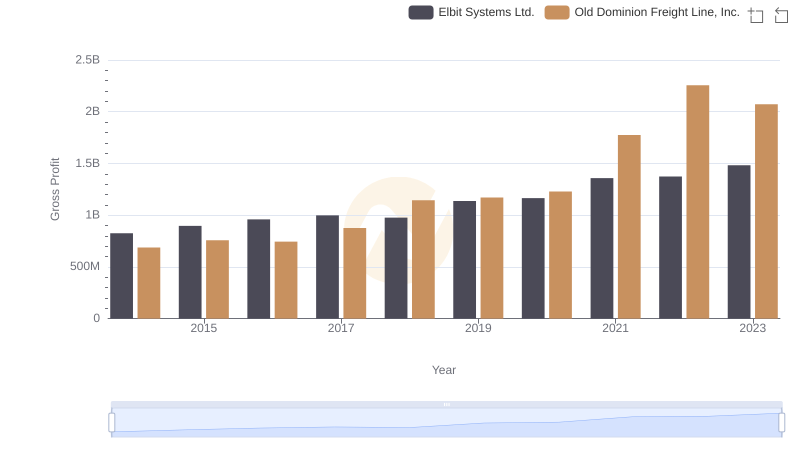
Gross Profit Trends Compared: Old Dominion Freight Line, Inc. vs Elbit Systems Ltd.