| __timestamp | Curtiss-Wright Corporation | Old Dominion Freight Line, Inc. |
|---|---|---|
| Wednesday, January 1, 2014 | 1466610000 | 2100409000 |
| Thursday, January 1, 2015 | 1422428000 | 2214943000 |
| Friday, January 1, 2016 | 1358448000 | 2246890000 |
| Sunday, January 1, 2017 | 1452431000 | 2482732000 |
| Monday, January 1, 2018 | 1540574000 | 2899452000 |
| Tuesday, January 1, 2019 | 1589216000 | 2938895000 |
| Wednesday, January 1, 2020 | 1550109000 | 2786531000 |
| Friday, January 1, 2021 | 1572575000 | 3481268000 |
| Saturday, January 1, 2022 | 1602416000 | 4003951000 |
| Sunday, January 1, 2023 | 1778195000 | 3793953000 |
| Monday, January 1, 2024 | 1967640000 |
Unveiling the hidden dimensions of data
In the ever-evolving landscape of the transportation and manufacturing sectors, understanding cost dynamics is crucial. From 2014 to 2023, Old Dominion Freight Line, Inc. and Curtiss-Wright Corporation have shown distinct trends in their cost of revenue. Old Dominion Freight Line, a leader in freight transportation, saw a remarkable 80% increase in its cost of revenue, peaking in 2022. This reflects its aggressive expansion and adaptation to market demands. Meanwhile, Curtiss-Wright Corporation, a stalwart in the manufacturing industry, experienced a steadier growth of approximately 21% over the same period, indicating a more conservative approach to cost management. These insights highlight the contrasting strategies of two industry giants, offering a window into their operational efficiencies and market positioning. As businesses navigate economic fluctuations, such data-driven insights become invaluable for strategic planning.
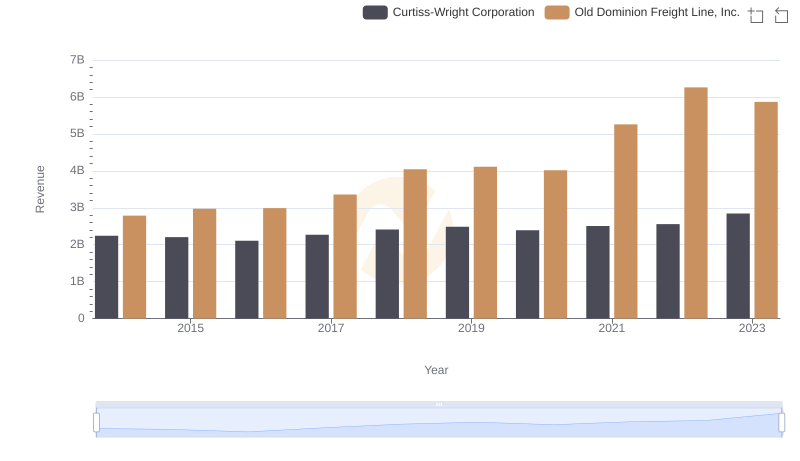
Annual Revenue Comparison: Old Dominion Freight Line, Inc. vs Curtiss-Wright Corporation
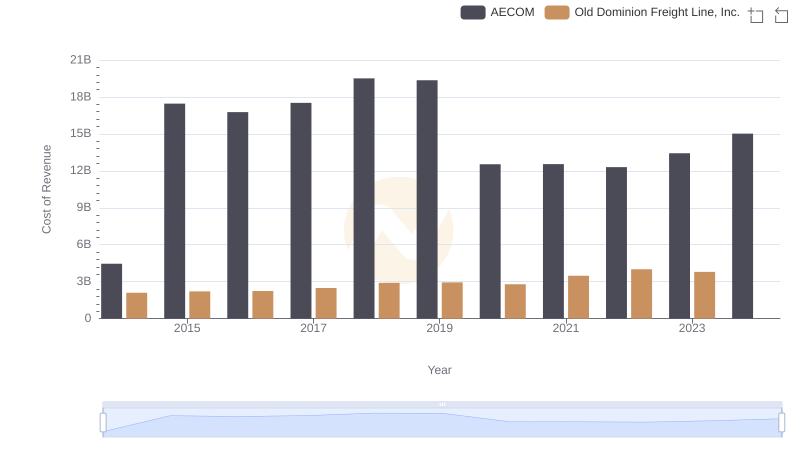
Cost of Revenue: Key Insights for Old Dominion Freight Line, Inc. and AECOM
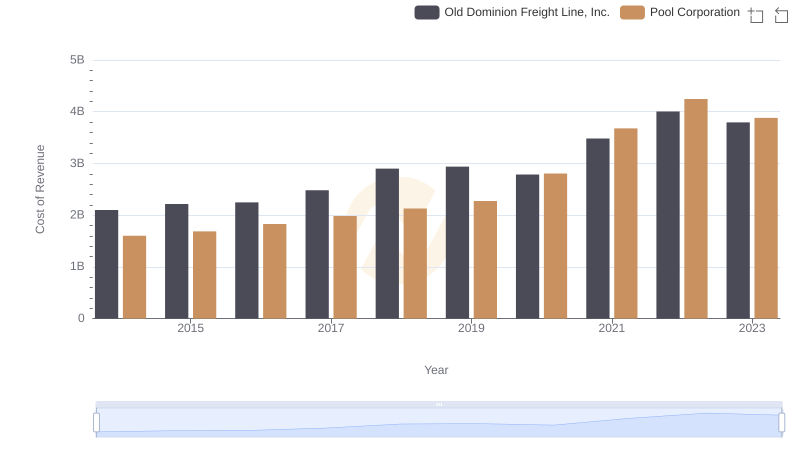
Cost of Revenue: Key Insights for Old Dominion Freight Line, Inc. and Pool Corporation
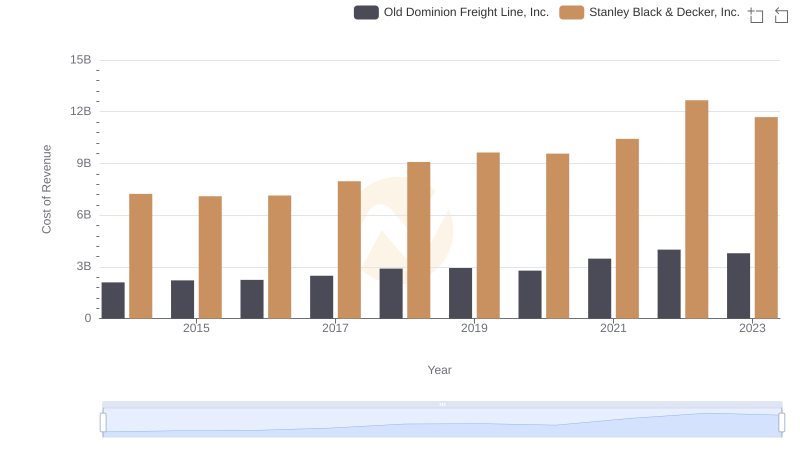
Cost Insights: Breaking Down Old Dominion Freight Line, Inc. and Stanley Black & Decker, Inc.'s Expenses
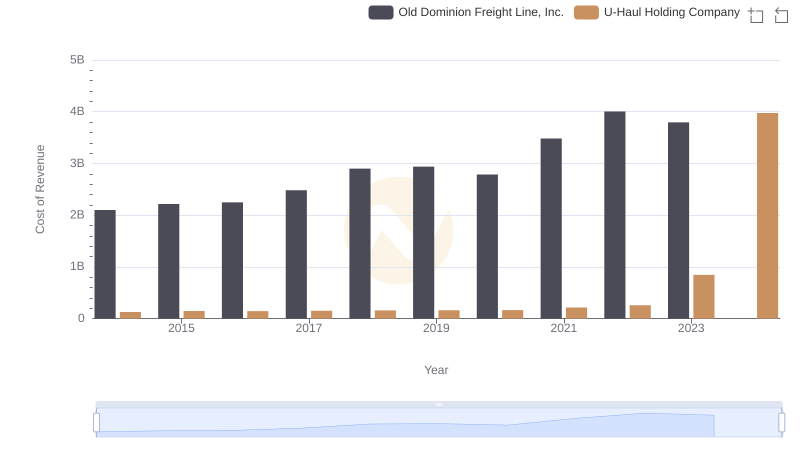
Cost of Revenue Trends: Old Dominion Freight Line, Inc. vs U-Haul Holding Company
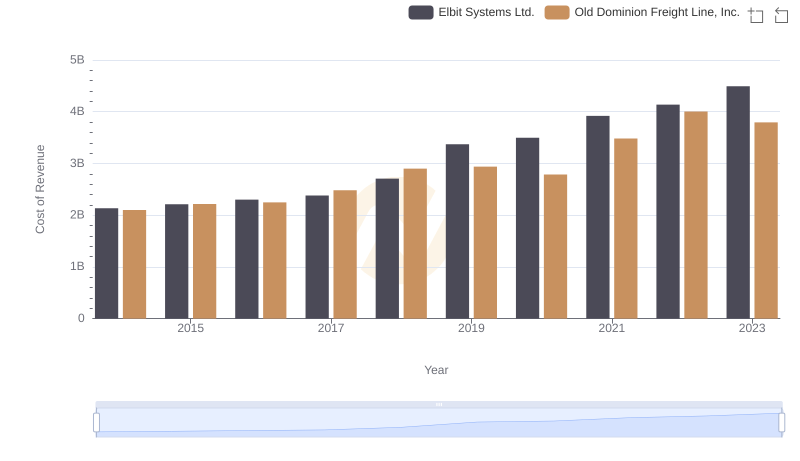
Analyzing Cost of Revenue: Old Dominion Freight Line, Inc. and Elbit Systems Ltd.
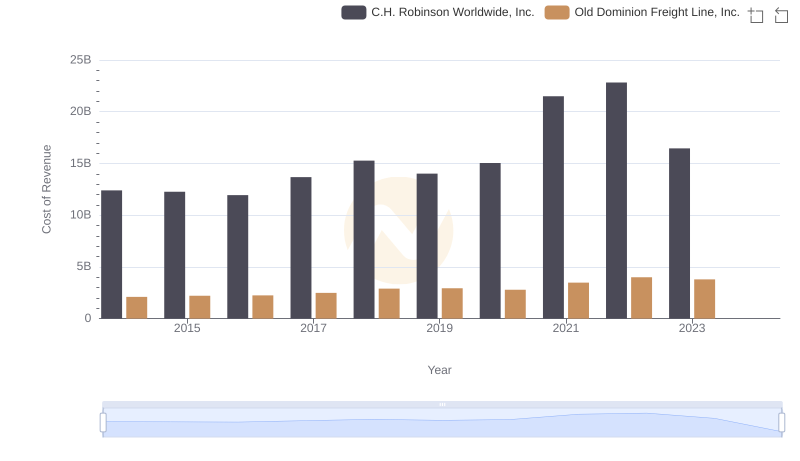
Comparing Cost of Revenue Efficiency: Old Dominion Freight Line, Inc. vs C.H. Robinson Worldwide, Inc.
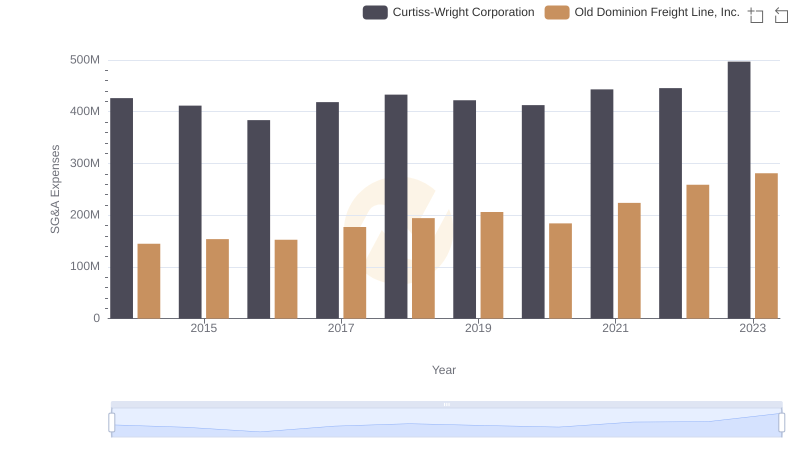
Cost Management Insights: SG&A Expenses for Old Dominion Freight Line, Inc. and Curtiss-Wright Corporation
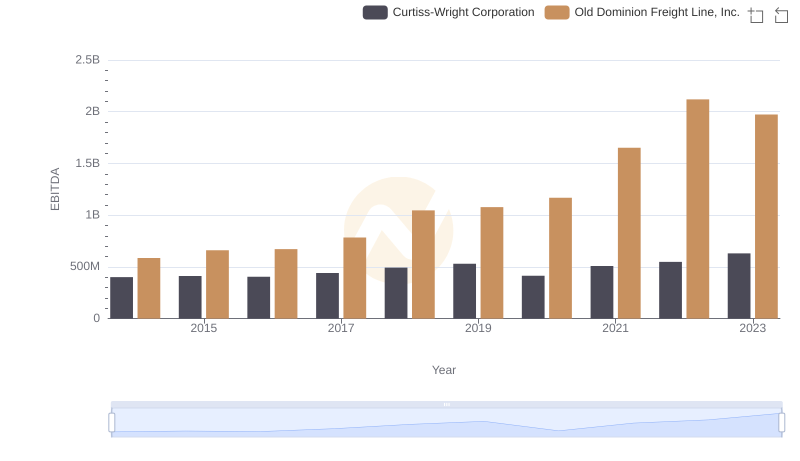
Professional EBITDA Benchmarking: Old Dominion Freight Line, Inc. vs Curtiss-Wright Corporation