| __timestamp | Global Payments Inc. | ITT Inc. |
|---|---|---|
| Wednesday, January 1, 2014 | 2773718000 | 2654600000 |
| Thursday, January 1, 2015 | 2898150000 | 2485600000 |
| Friday, January 1, 2016 | 3370976000 | 2405400000 |
| Sunday, January 1, 2017 | 3975163000 | 2585300000 |
| Monday, January 1, 2018 | 3366366000 | 2745100000 |
| Tuesday, January 1, 2019 | 4911892000 | 2846400000 |
| Wednesday, January 1, 2020 | 7423558000 | 2477800000 |
| Friday, January 1, 2021 | 8523762000 | 2765000000 |
| Saturday, January 1, 2022 | 8975515000 | 2987700000 |
| Sunday, January 1, 2023 | 9654419000 | 3283000000 |
| Monday, January 1, 2024 | 10105894000 | 3630700000 |
Cracking the code
In the ever-evolving landscape of financial services and industrial manufacturing, Global Payments Inc. and ITT Inc. have demonstrated distinct revenue trajectories over the past decade. From 2014 to 2023, Global Payments Inc. has seen a remarkable revenue growth of approximately 248%, starting from $2.77 billion in 2014 and reaching $9.65 billion in 2023. This growth underscores the company's strategic expansions and adaptability in the digital payments sector.
Conversely, ITT Inc., a stalwart in the industrial manufacturing sector, has maintained a steady revenue increase of about 24% over the same period, from $2.65 billion to $3.28 billion. This stability highlights ITT's resilience and consistent performance amidst global economic fluctuations.
These contrasting growth patterns offer a fascinating insight into how different sectors respond to market dynamics, with Global Payments Inc. capitalizing on digital trends and ITT Inc. focusing on steady industrial demand.
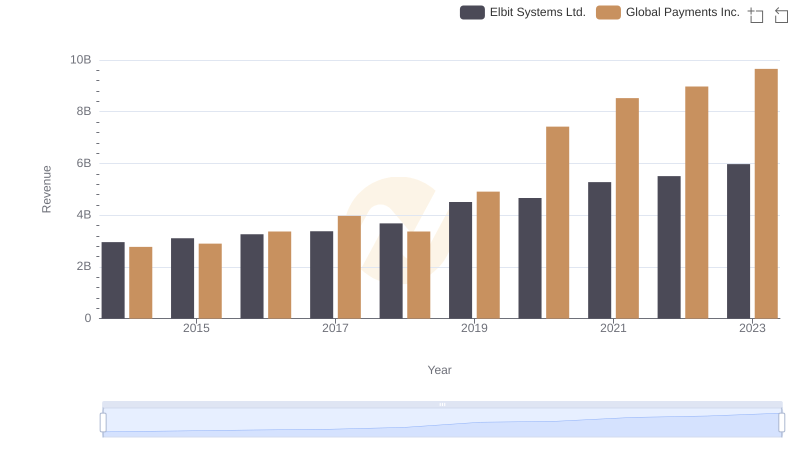
Global Payments Inc. vs Elbit Systems Ltd.: Annual Revenue Growth Compared

Breaking Down Revenue Trends: Global Payments Inc. vs C.H. Robinson Worldwide, Inc.
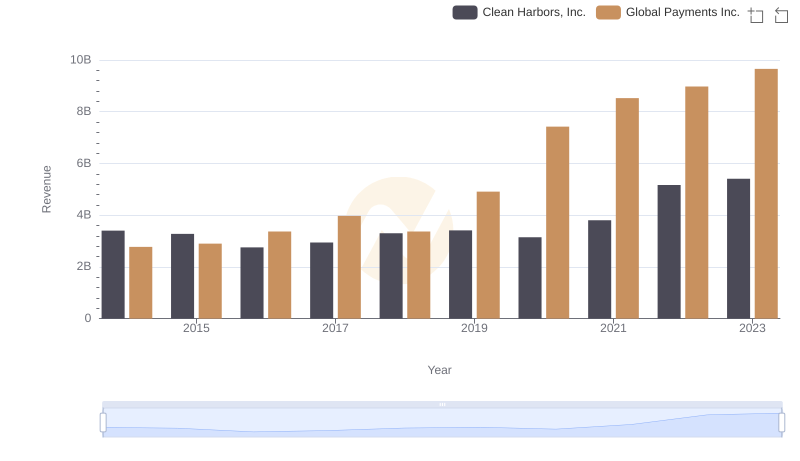
Global Payments Inc. or Clean Harbors, Inc.: Who Leads in Yearly Revenue?
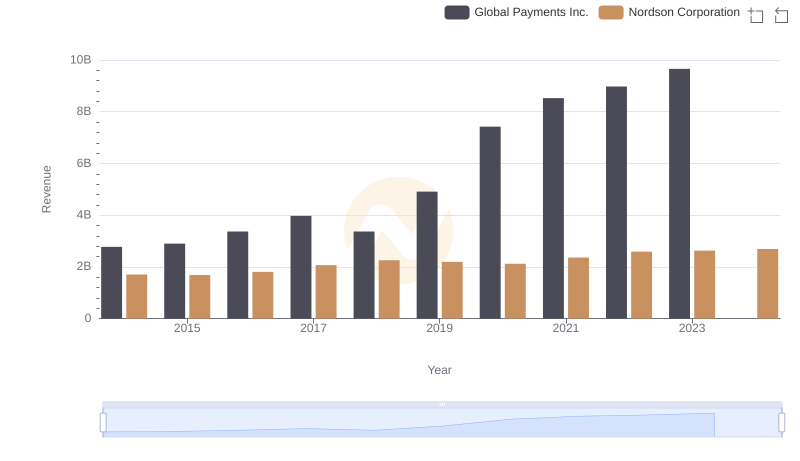
Global Payments Inc. vs Nordson Corporation: Examining Key Revenue Metrics
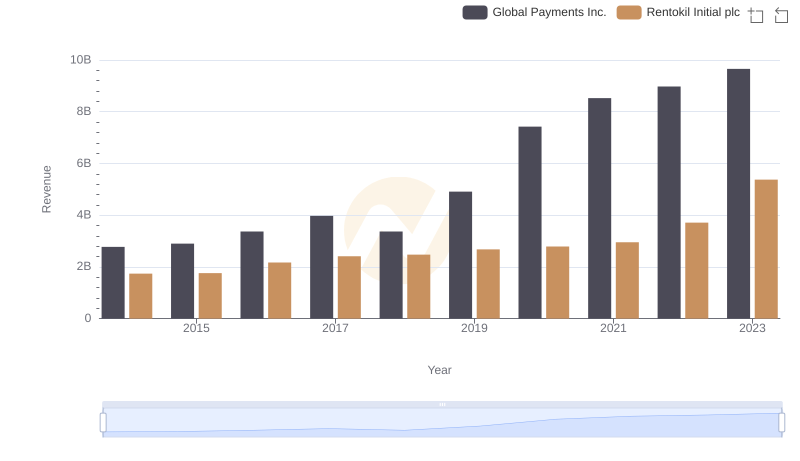
Global Payments Inc. or Rentokil Initial plc: Who Leads in Yearly Revenue?
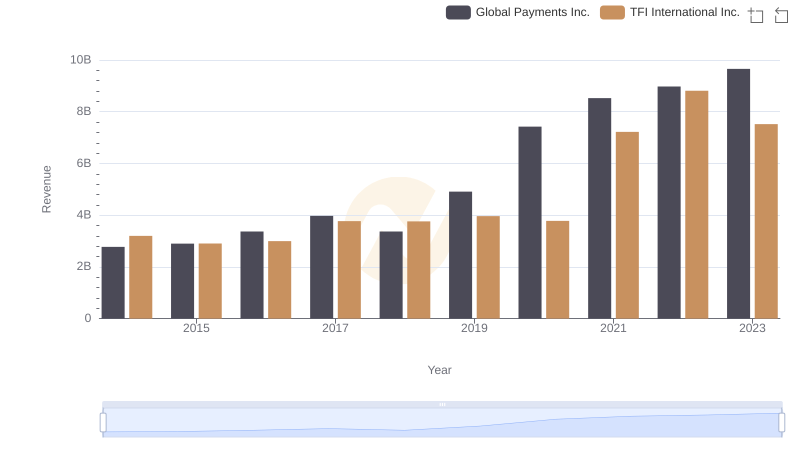
Global Payments Inc. vs TFI International Inc.: Annual Revenue Growth Compared
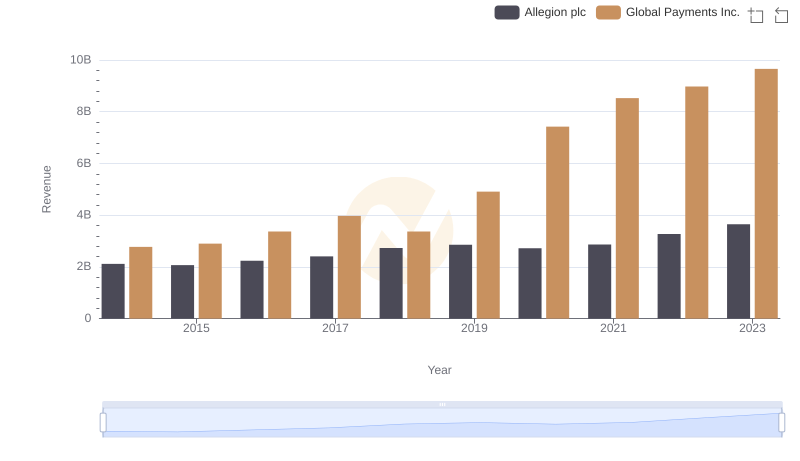
Global Payments Inc. vs Allegion plc: Examining Key Revenue Metrics
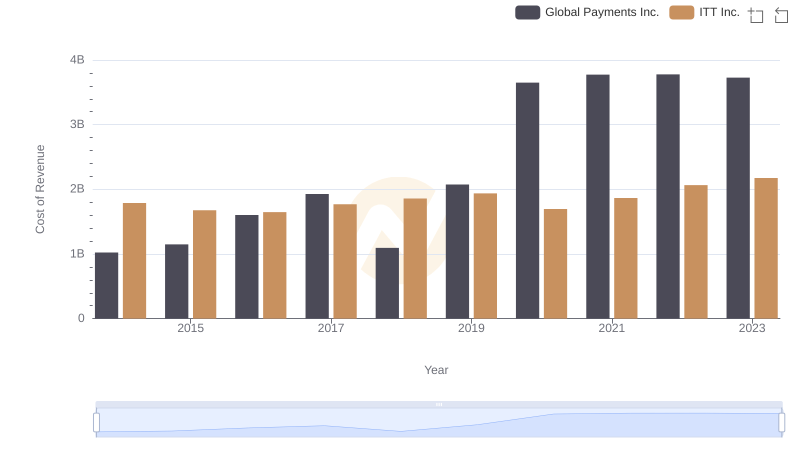
Cost of Revenue: Key Insights for Global Payments Inc. and ITT Inc.
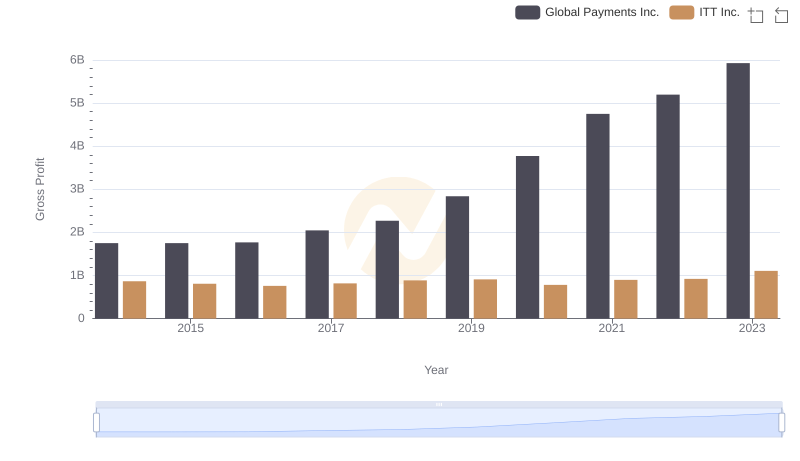
Who Generates Higher Gross Profit? Global Payments Inc. or ITT Inc.
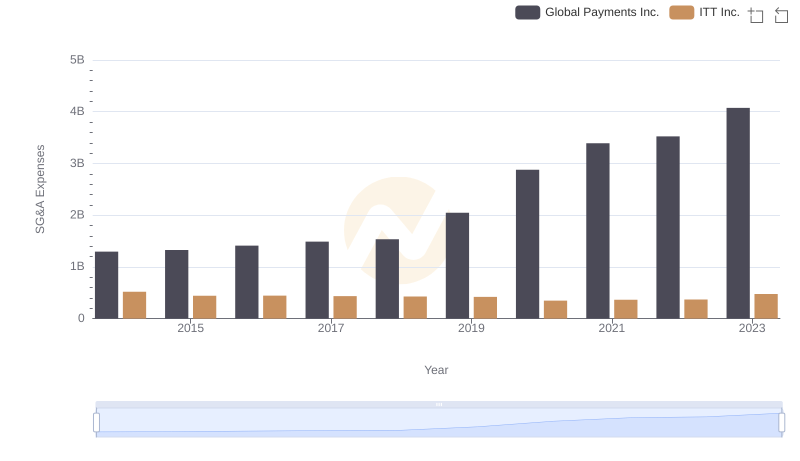
Global Payments Inc. or ITT Inc.: Who Manages SG&A Costs Better?