| __timestamp | Cisco Systems, Inc. | NetEase, Inc. |
|---|---|---|
| Wednesday, January 1, 2014 | 47142000000 | 11712834000 |
| Thursday, January 1, 2015 | 49161000000 | 22802895000 |
| Friday, January 1, 2016 | 49247000000 | 38178844000 |
| Sunday, January 1, 2017 | 48005000000 | 54102019000 |
| Monday, January 1, 2018 | 49330000000 | 67156453000 |
| Tuesday, January 1, 2019 | 51904000000 | 59241145000 |
| Wednesday, January 1, 2020 | 49301000000 | 73667133000 |
| Friday, January 1, 2021 | 49818000000 | 87606026000 |
| Saturday, January 1, 2022 | 51557000000 | 96495809000 |
| Sunday, January 1, 2023 | 56998000000 | 103468159000 |
| Monday, January 1, 2024 | 53803000000 |
Unleashing the power of data
In the ever-evolving landscape of technology and digital services, Cisco Systems, Inc. and NetEase, Inc. have emerged as formidable players. Over the past decade, from 2014 to 2023, these giants have showcased impressive revenue trajectories, reflecting their strategic prowess and market adaptability.
Cisco Systems, Inc., a stalwart in networking solutions, has seen its revenue grow by approximately 21% over this period. Notably, 2023 marked a peak with a 12% increase from the previous year, underscoring its resilience in a competitive market.
Meanwhile, NetEase, Inc., a leader in online gaming and internet services, has experienced a staggering 783% revenue surge since 2014. This growth trajectory highlights its dominance in the digital entertainment sector, with 2023 revenues reaching unprecedented heights.
While 2024 data for NetEase remains elusive, the trends thus far paint a compelling picture of innovation and growth in the tech industry.
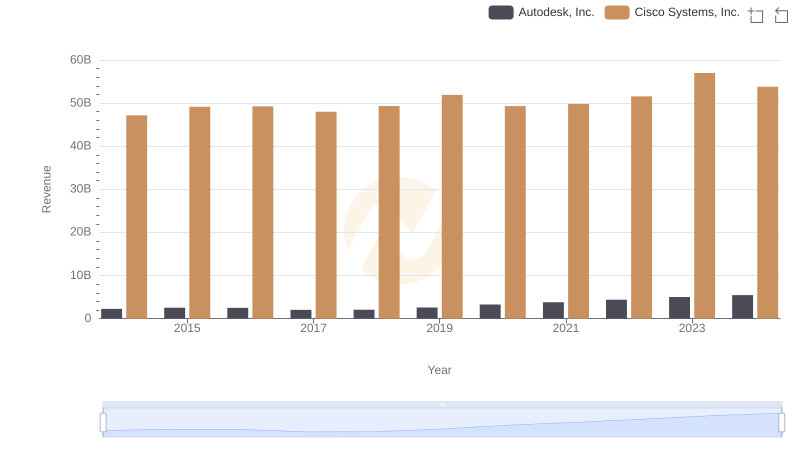
Comparing Revenue Performance: Cisco Systems, Inc. or Autodesk, Inc.?
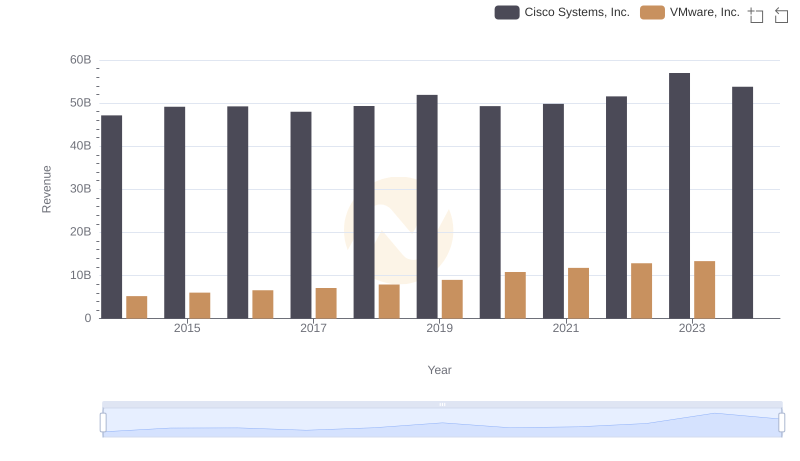
Annual Revenue Comparison: Cisco Systems, Inc. vs VMware, Inc.
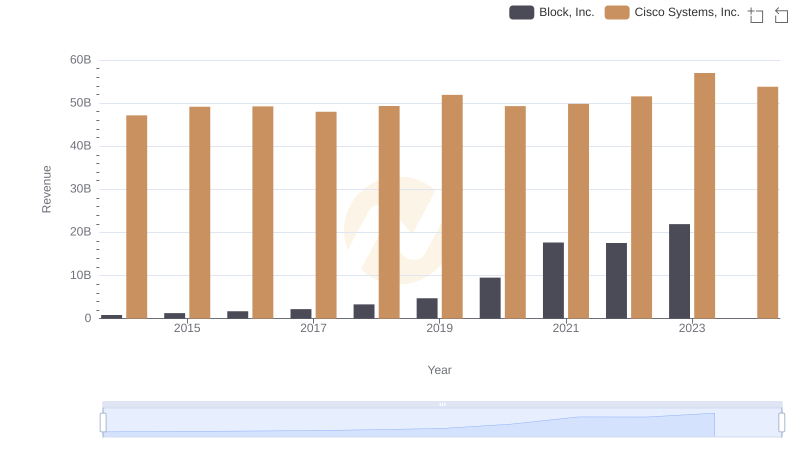
Revenue Insights: Cisco Systems, Inc. and Block, Inc. Performance Compared
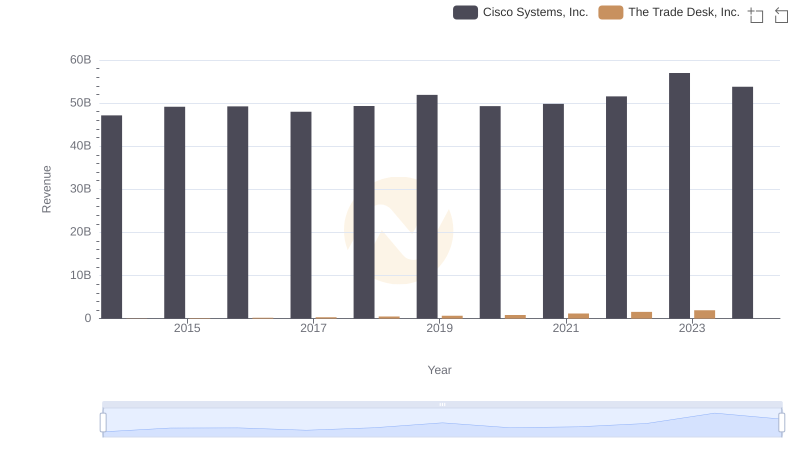
Cisco Systems, Inc. or The Trade Desk, Inc.: Who Leads in Yearly Revenue?
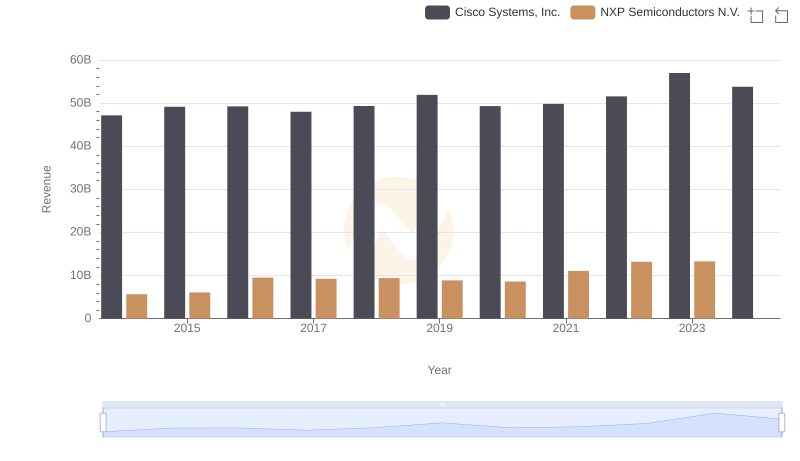
Cisco Systems, Inc. and NXP Semiconductors N.V.: A Comprehensive Revenue Analysis
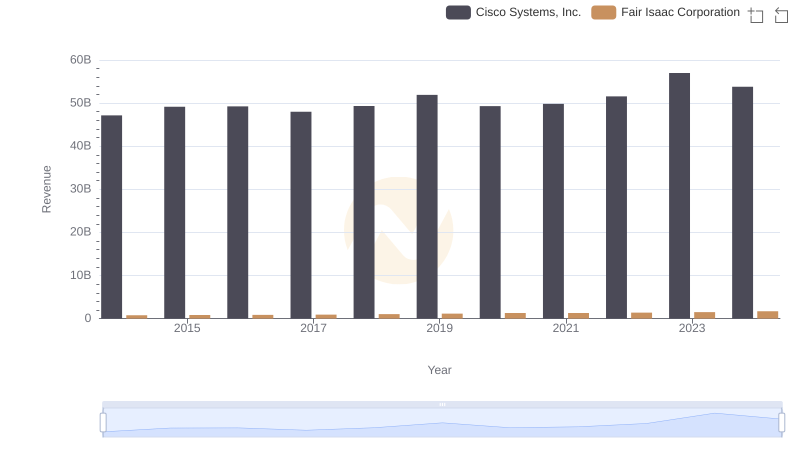
Annual Revenue Comparison: Cisco Systems, Inc. vs Fair Isaac Corporation

Breaking Down Revenue Trends: Cisco Systems, Inc. vs TE Connectivity Ltd.
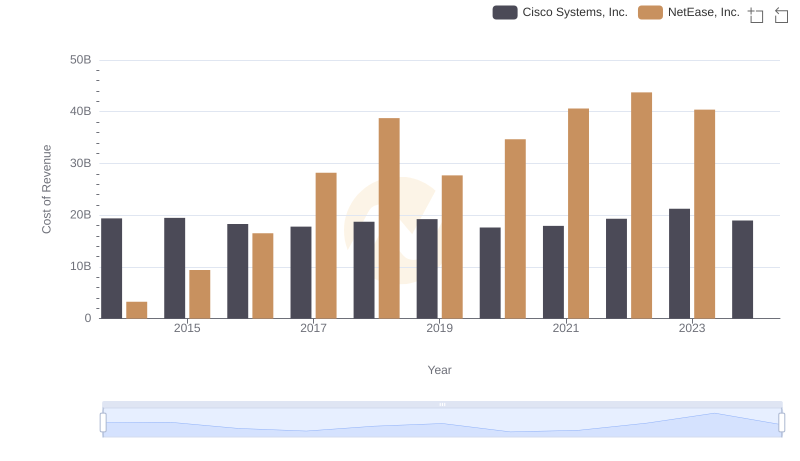
Cost of Revenue: Key Insights for Cisco Systems, Inc. and NetEase, Inc.
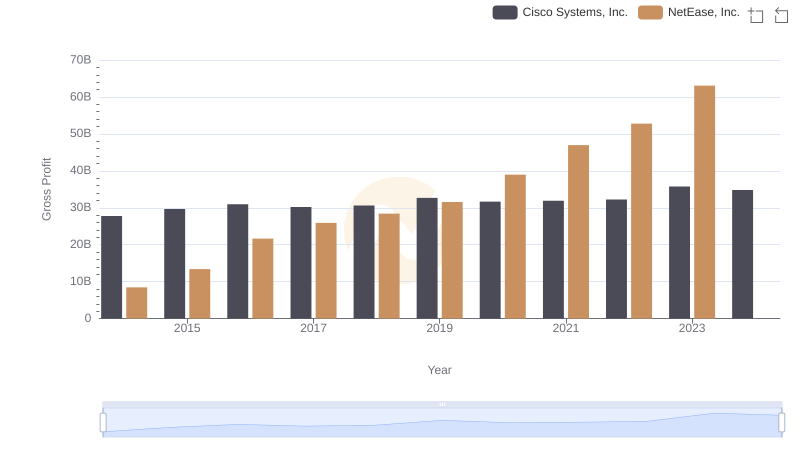
Gross Profit Comparison: Cisco Systems, Inc. and NetEase, Inc. Trends
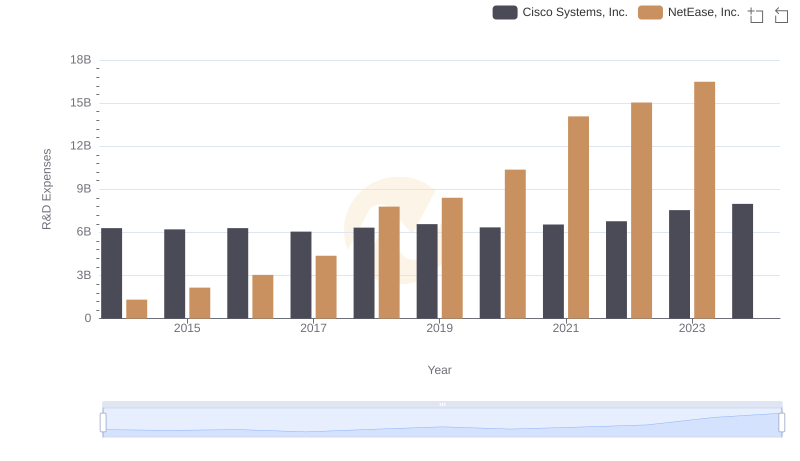
Research and Development: Comparing Key Metrics for Cisco Systems, Inc. and NetEase, Inc.
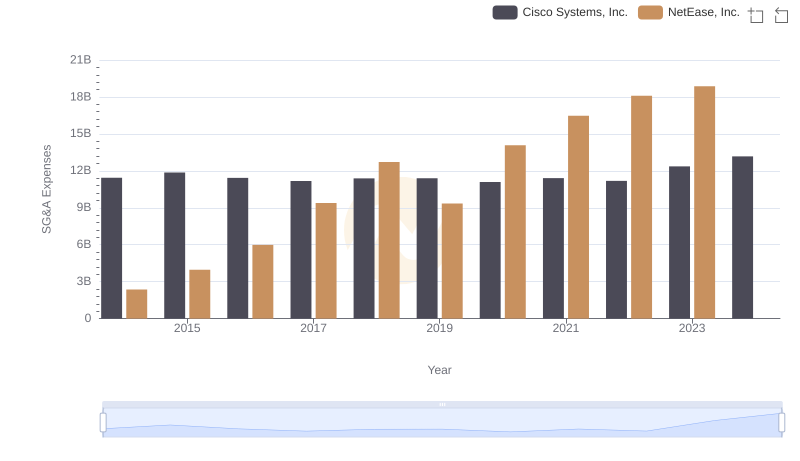
Selling, General, and Administrative Costs: Cisco Systems, Inc. vs NetEase, Inc.
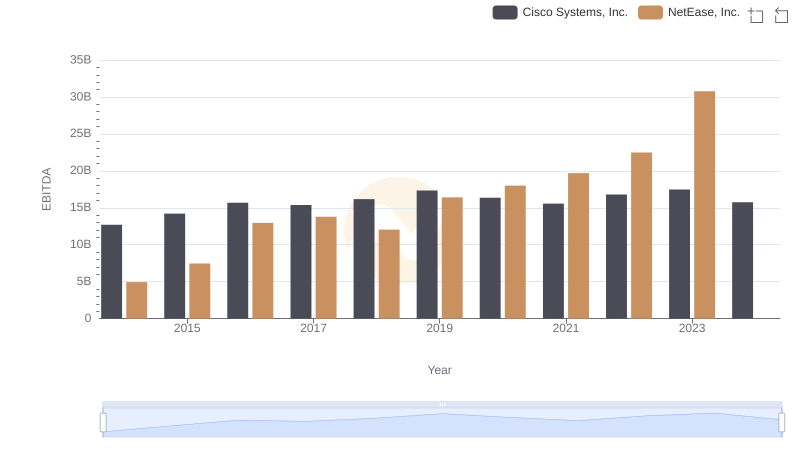
Comparative EBITDA Analysis: Cisco Systems, Inc. vs NetEase, Inc.