| __timestamp | Cisco Systems, Inc. | NetEase, Inc. |
|---|---|---|
| Wednesday, January 1, 2014 | 11437000000 | 2362667000 |
| Thursday, January 1, 2015 | 11861000000 | 3972624000 |
| Friday, January 1, 2016 | 11433000000 | 5987969000 |
| Sunday, January 1, 2017 | 11177000000 | 9387454000 |
| Monday, January 1, 2018 | 11386000000 | 12718007000 |
| Tuesday, January 1, 2019 | 11398000000 | 9351425000 |
| Wednesday, January 1, 2020 | 11094000000 | 14075615000 |
| Friday, January 1, 2021 | 11411000000 | 16477740000 |
| Saturday, January 1, 2022 | 11186000000 | 18098519000 |
| Sunday, January 1, 2023 | 12358000000 | 18869340000 |
| Monday, January 1, 2024 | 13177000000 |
Data in motion
In the ever-evolving landscape of global business, understanding the financial strategies of industry giants like Cisco Systems, Inc. and NetEase, Inc. is crucial. Over the past decade, from 2014 to 2023, these two companies have demonstrated distinct approaches to managing their Selling, General, and Administrative (SG&A) expenses.
Cisco Systems, Inc. has maintained a relatively stable SG&A expense pattern, with a slight increase of approximately 15% from 2014 to 2023. In contrast, NetEase, Inc. has shown a dramatic rise, with expenses growing nearly eightfold during the same period. This stark difference highlights the contrasting business models and market strategies of a tech hardware leader versus a digital entertainment powerhouse.
Interestingly, the data for 2024 is incomplete for NetEase, Inc., suggesting potential shifts or strategic changes. As these companies continue to adapt, their financial decisions will undoubtedly shape their future trajectories.
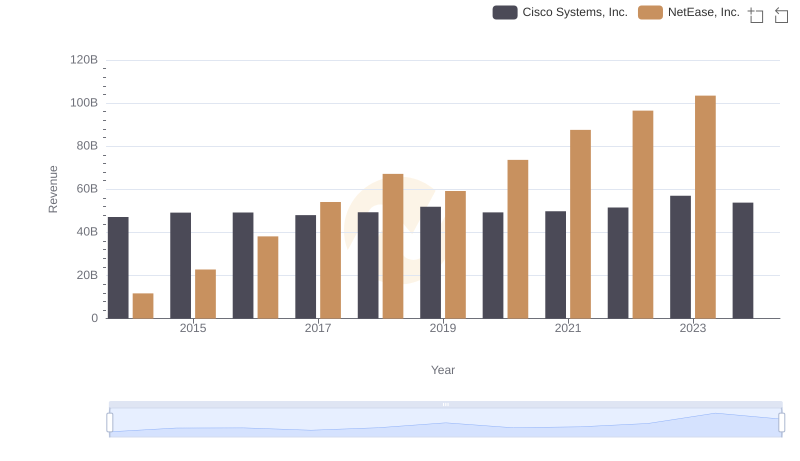
Annual Revenue Comparison: Cisco Systems, Inc. vs NetEase, Inc.
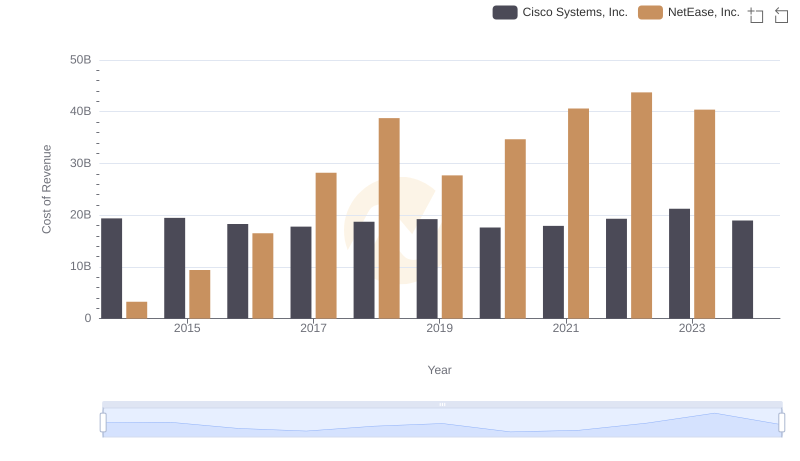
Cost of Revenue: Key Insights for Cisco Systems, Inc. and NetEase, Inc.
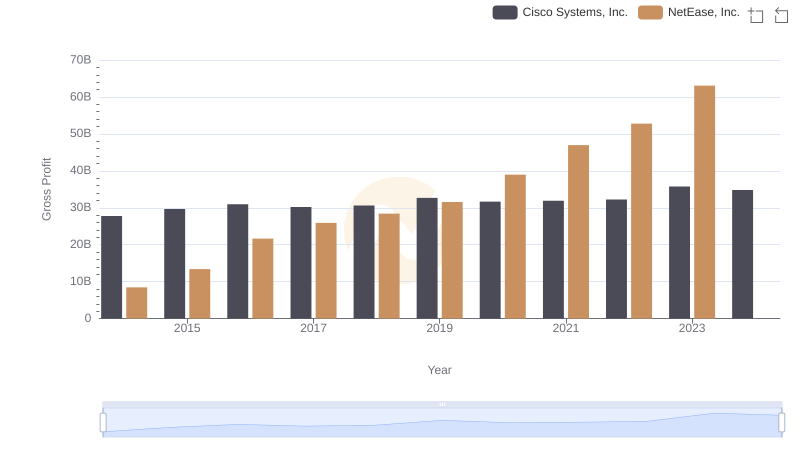
Gross Profit Comparison: Cisco Systems, Inc. and NetEase, Inc. Trends
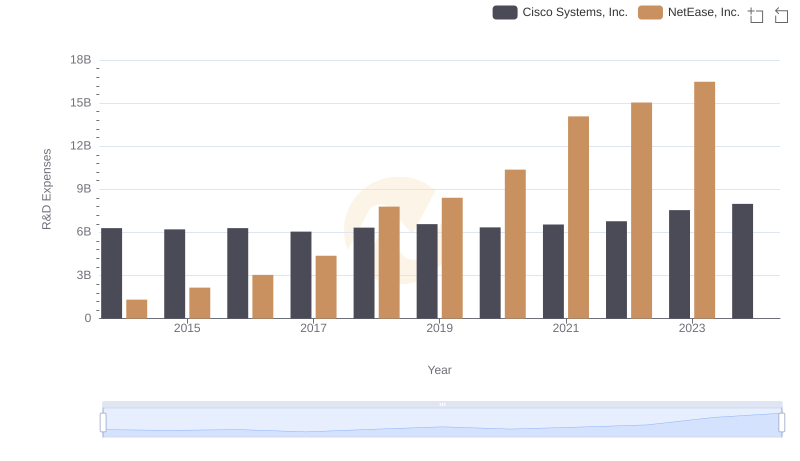
Research and Development: Comparing Key Metrics for Cisco Systems, Inc. and NetEase, Inc.
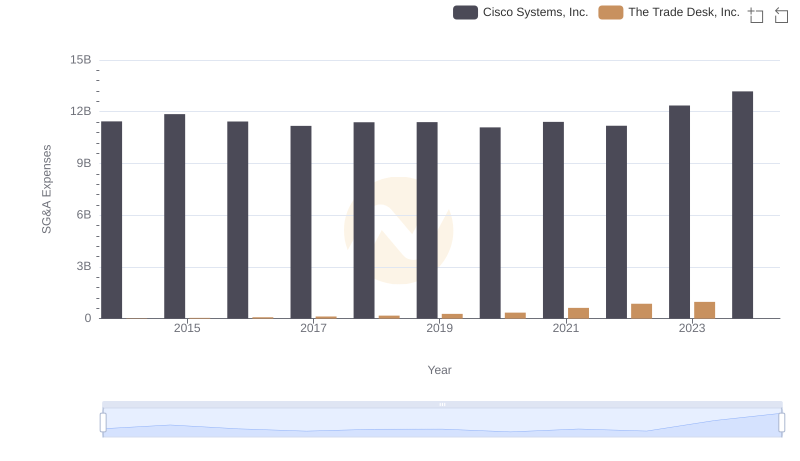
Cost Management Insights: SG&A Expenses for Cisco Systems, Inc. and The Trade Desk, Inc.
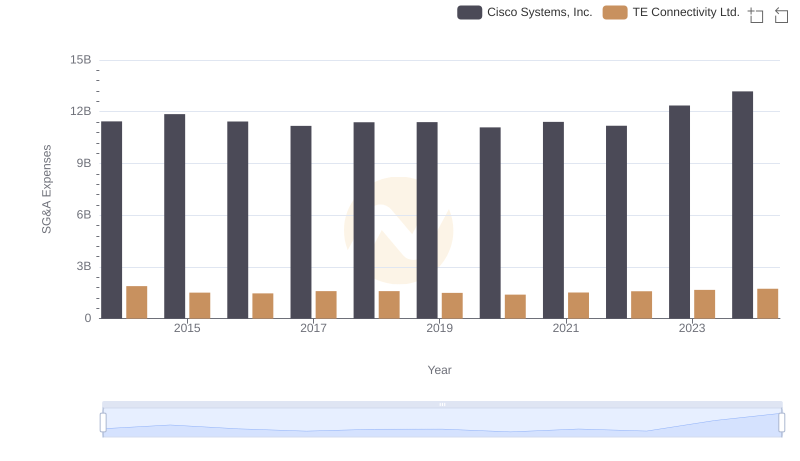
Who Optimizes SG&A Costs Better? Cisco Systems, Inc. or TE Connectivity Ltd.
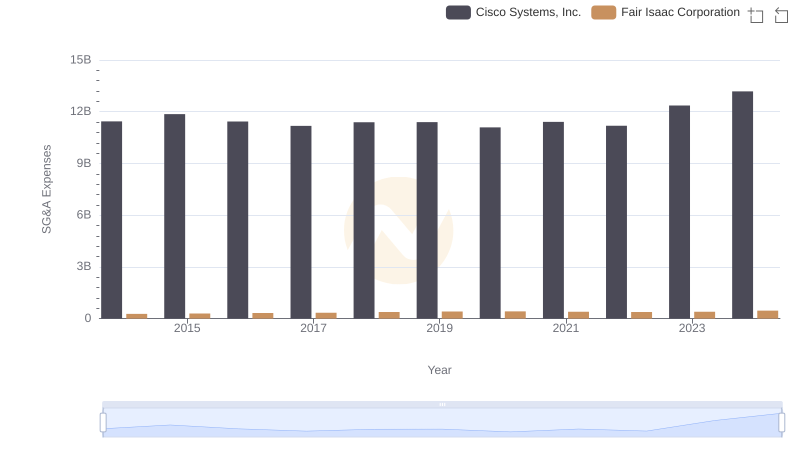
SG&A Efficiency Analysis: Comparing Cisco Systems, Inc. and Fair Isaac Corporation
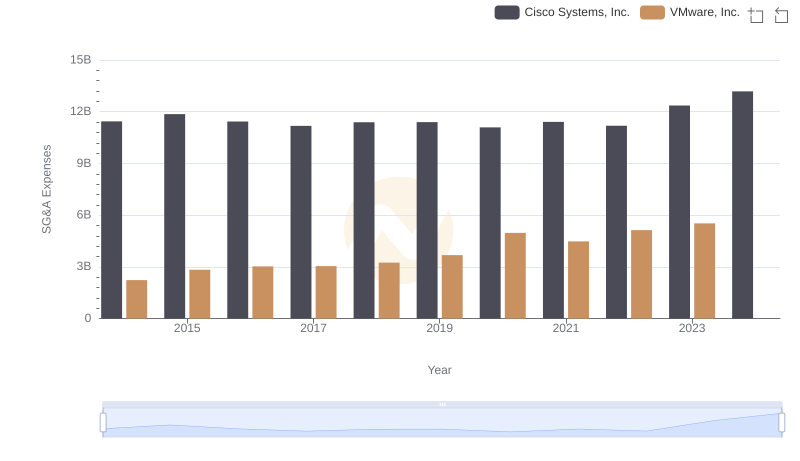
Cost Management Insights: SG&A Expenses for Cisco Systems, Inc. and VMware, Inc.
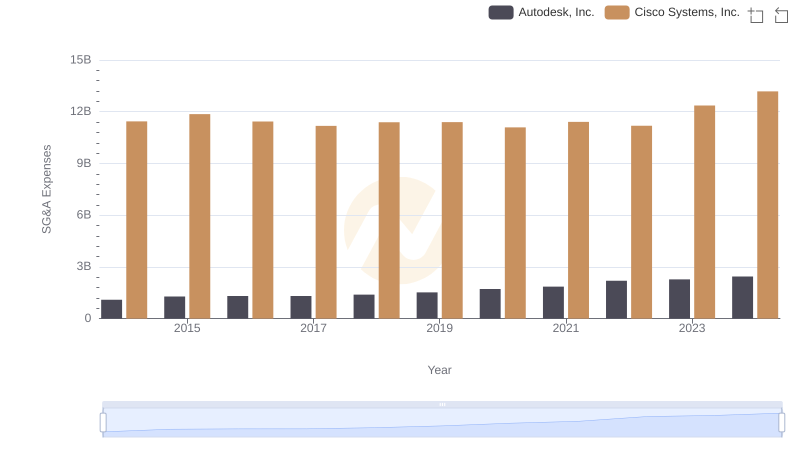
Breaking Down SG&A Expenses: Cisco Systems, Inc. vs Autodesk, Inc.
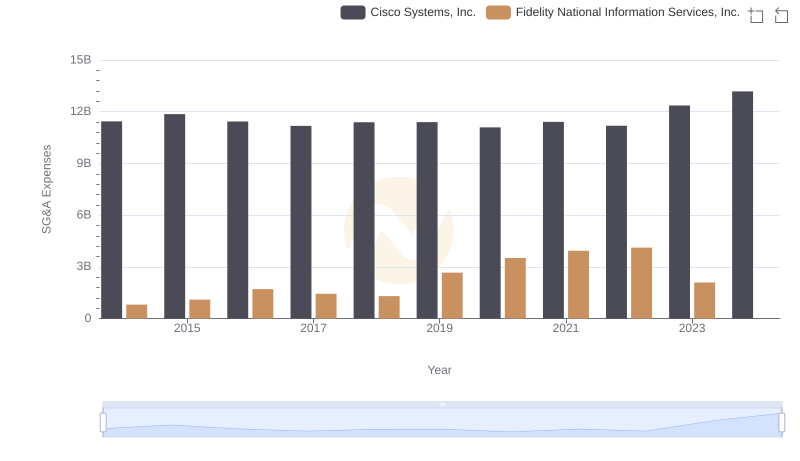
Breaking Down SG&A Expenses: Cisco Systems, Inc. vs Fidelity National Information Services, Inc.
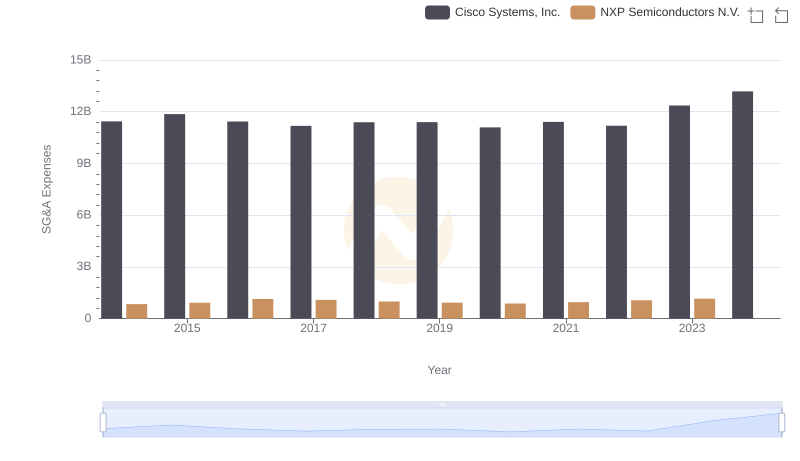
Cisco Systems, Inc. or NXP Semiconductors N.V.: Who Manages SG&A Costs Better?
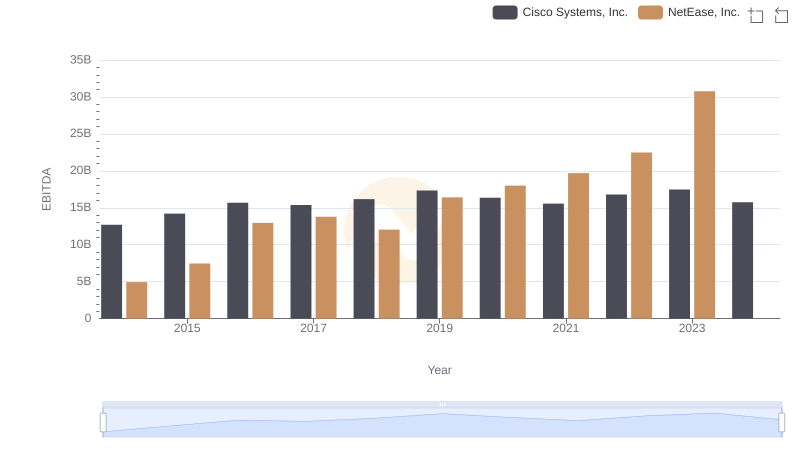
Comparative EBITDA Analysis: Cisco Systems, Inc. vs NetEase, Inc.