| __timestamp | Cintas Corporation | Pool Corporation |
|---|---|---|
| Wednesday, January 1, 2014 | 793811000 | 204752000 |
| Thursday, January 1, 2015 | 877761000 | 233610000 |
| Friday, January 1, 2016 | 933728000 | 277836000 |
| Sunday, January 1, 2017 | 968293000 | 310096000 |
| Monday, January 1, 2018 | 1227852000 | 341804000 |
| Tuesday, January 1, 2019 | 1564228000 | 370520000 |
| Wednesday, January 1, 2020 | 1542737000 | 493425000 |
| Friday, January 1, 2021 | 1773591000 | 862810000 |
| Saturday, January 1, 2022 | 1990046000 | 1064808000 |
| Sunday, January 1, 2023 | 2221676000 | 786707000 |
| Monday, January 1, 2024 | 2523857000 |
Unleashing the power of data
In the competitive landscape of corporate America, Cintas Corporation and Pool Corporation have showcased remarkable financial trajectories over the past decade. From 2014 to 2023, Cintas Corporation's EBITDA surged by an impressive 218%, reflecting its robust business model and strategic expansions. In contrast, Pool Corporation, while experiencing a significant 284% increase in EBITDA from 2014 to 2022, faced a dip in 2023, highlighting the volatile nature of the market.
This comparative analysis underscores the dynamic shifts in the corporate sector, offering valuable insights for investors and stakeholders.
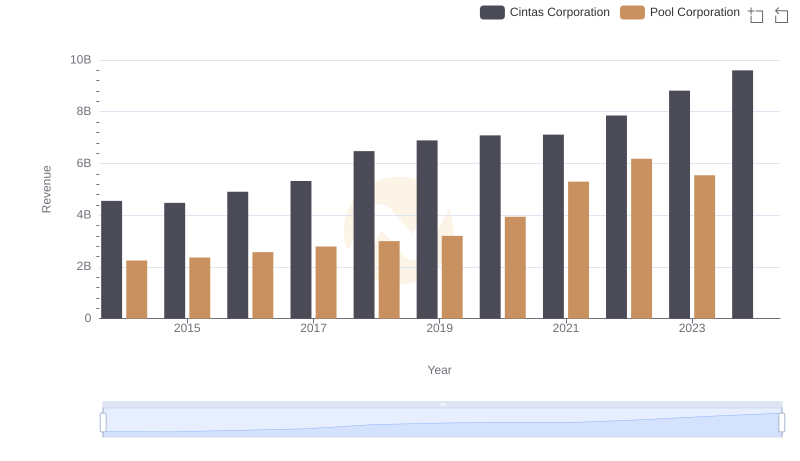
Who Generates More Revenue? Cintas Corporation or Pool Corporation
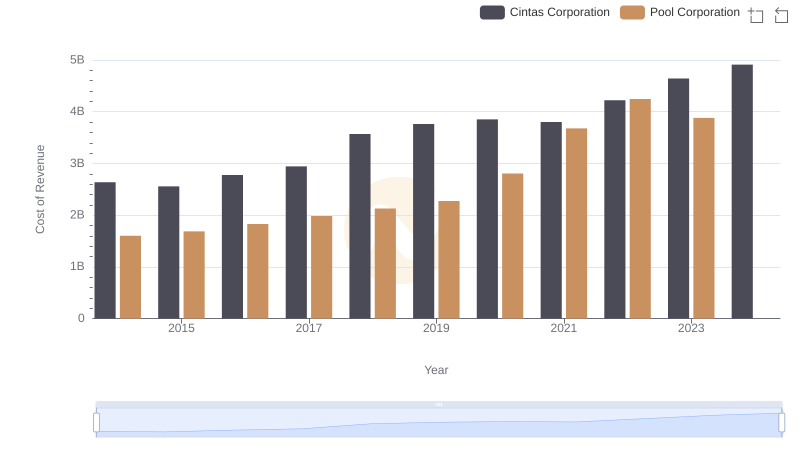
Cost of Revenue: Key Insights for Cintas Corporation and Pool Corporation
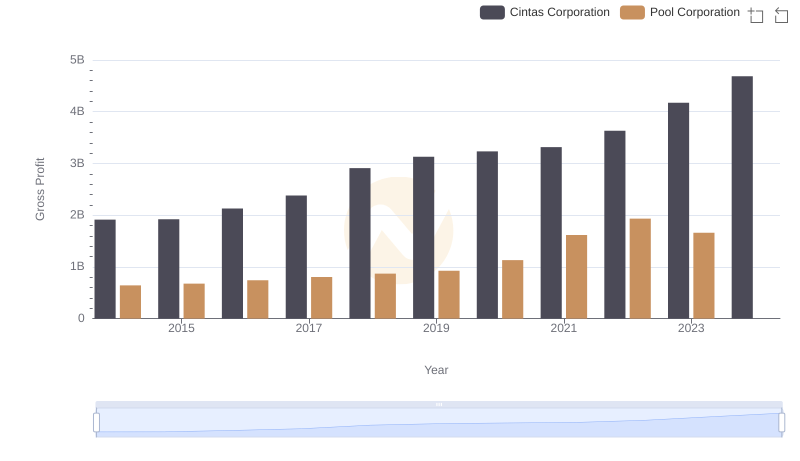
Who Generates Higher Gross Profit? Cintas Corporation or Pool Corporation
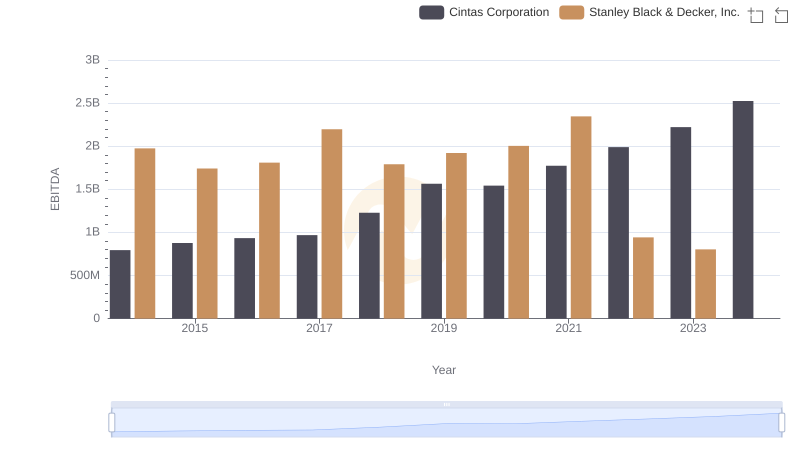
Comprehensive EBITDA Comparison: Cintas Corporation vs Stanley Black & Decker, Inc.
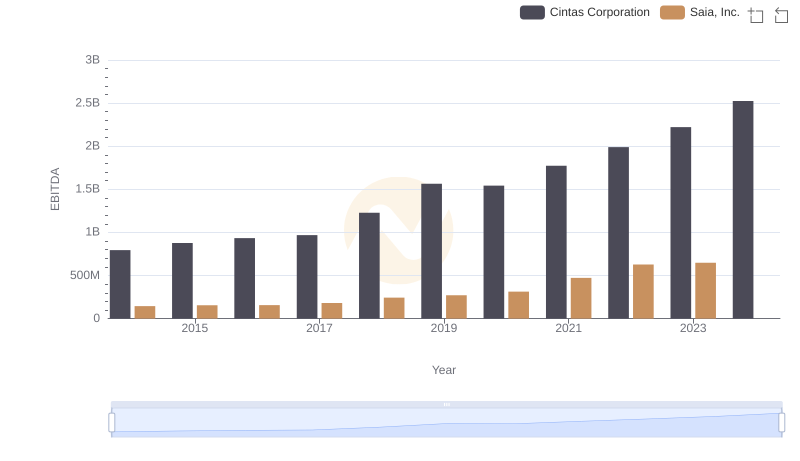
Cintas Corporation and Saia, Inc.: A Detailed Examination of EBITDA Performance
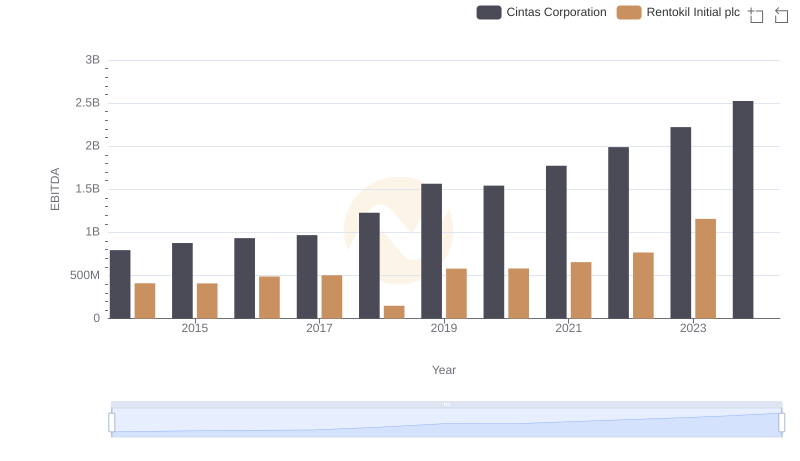
Comparative EBITDA Analysis: Cintas Corporation vs Rentokil Initial plc
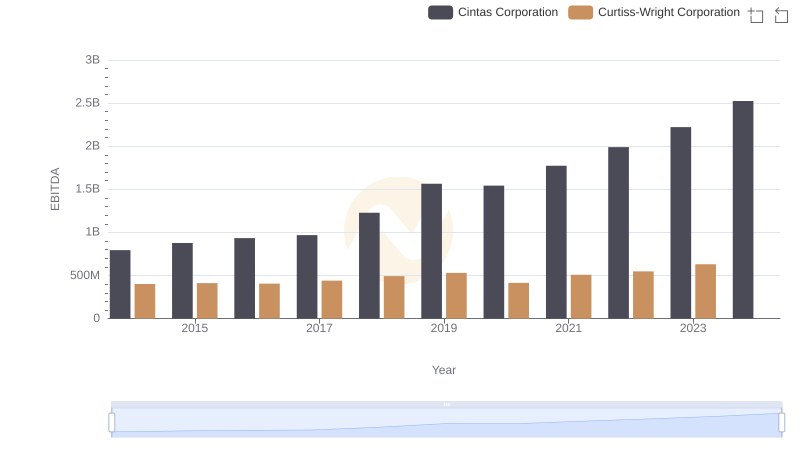
Comprehensive EBITDA Comparison: Cintas Corporation vs Curtiss-Wright Corporation
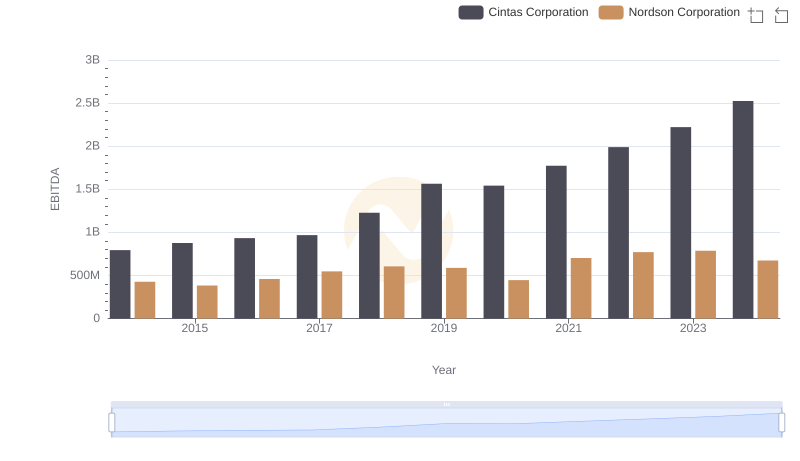
Comparative EBITDA Analysis: Cintas Corporation vs Nordson Corporation