| __timestamp | AMETEK, Inc. | Pool Corporation |
|---|---|---|
| Wednesday, January 1, 2014 | 2597017000 | 1603222000 |
| Thursday, January 1, 2015 | 2549280000 | 1687495000 |
| Friday, January 1, 2016 | 2575220000 | 1829716000 |
| Sunday, January 1, 2017 | 2851431000 | 1982899000 |
| Monday, January 1, 2018 | 3186310000 | 2127924000 |
| Tuesday, January 1, 2019 | 3370897000 | 2274592000 |
| Wednesday, January 1, 2020 | 2996515000 | 2805721000 |
| Friday, January 1, 2021 | 3633900000 | 3678492000 |
| Saturday, January 1, 2022 | 4005261000 | 4246315000 |
| Sunday, January 1, 2023 | 4212484999 | 3881551000 |
| Monday, January 1, 2024 | 0 |
Unveiling the hidden dimensions of data
In the ever-evolving landscape of industrial and consumer markets, understanding cost dynamics is crucial. From 2014 to 2023, AMETEK, Inc. and Pool Corporation have shown significant shifts in their cost of revenue. AMETEK, Inc. experienced a steady increase, with costs rising by approximately 62% over the decade, peaking in 2023. Meanwhile, Pool Corporation saw a remarkable 141% surge from 2014 to 2022, before a slight dip in 2023. This trend highlights the resilience and strategic adjustments of these companies in response to market demands and economic conditions. Notably, 2021 marked a pivotal year where both companies reached their highest cost levels, reflecting broader industry trends. As businesses navigate post-pandemic recovery, these insights offer a window into the financial strategies that drive success in competitive markets.
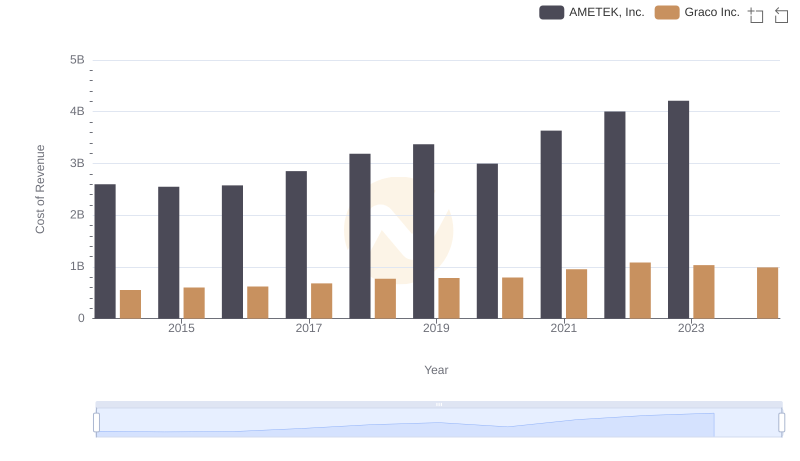
Cost of Revenue Trends: AMETEK, Inc. vs Graco Inc.
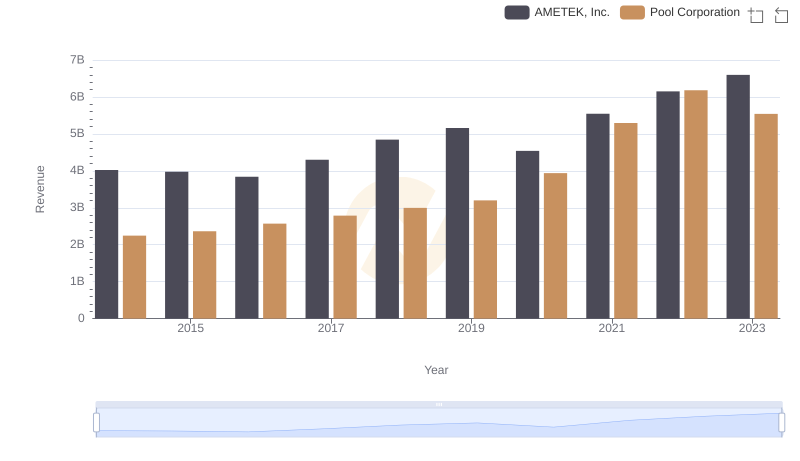
AMETEK, Inc. vs Pool Corporation: Annual Revenue Growth Compared
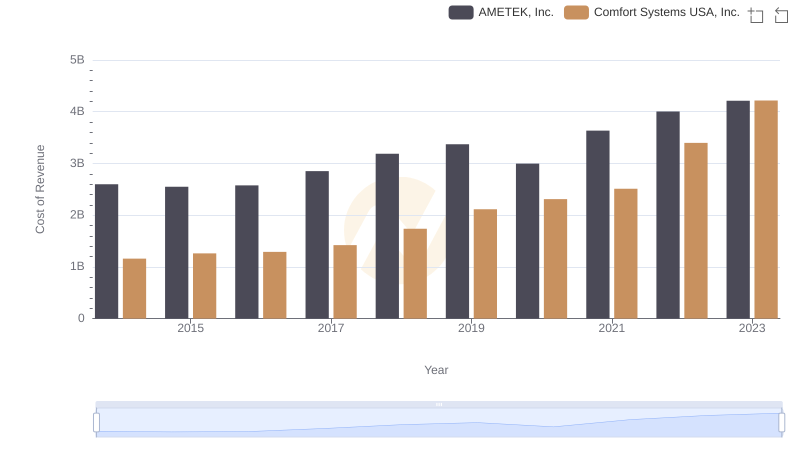
Cost of Revenue Comparison: AMETEK, Inc. vs Comfort Systems USA, Inc.
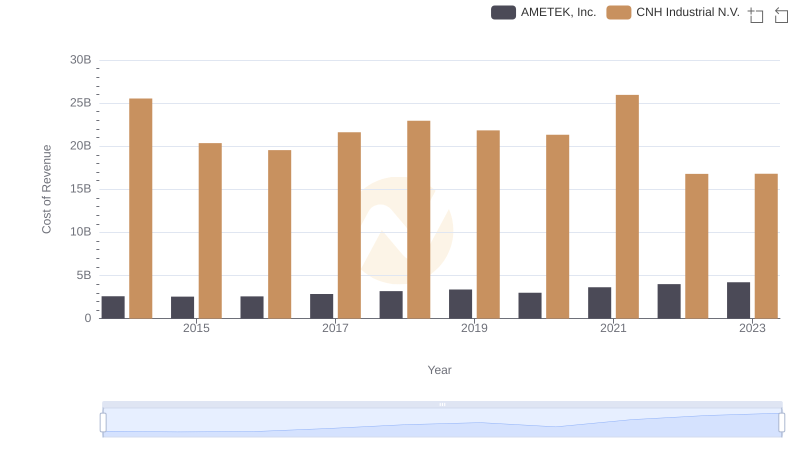
Cost Insights: Breaking Down AMETEK, Inc. and CNH Industrial N.V.'s Expenses
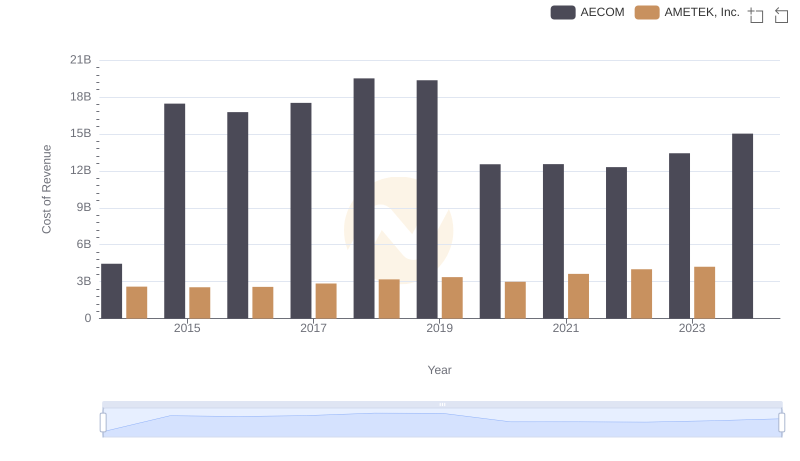
Cost of Revenue: Key Insights for AMETEK, Inc. and AECOM
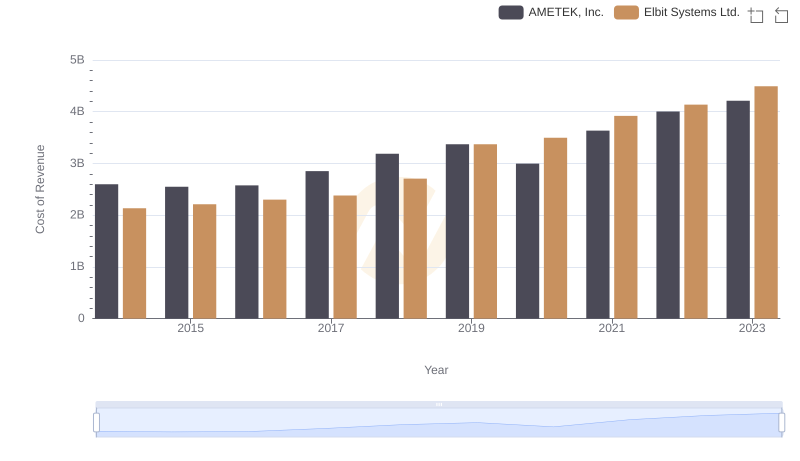
Cost of Revenue Comparison: AMETEK, Inc. vs Elbit Systems Ltd.
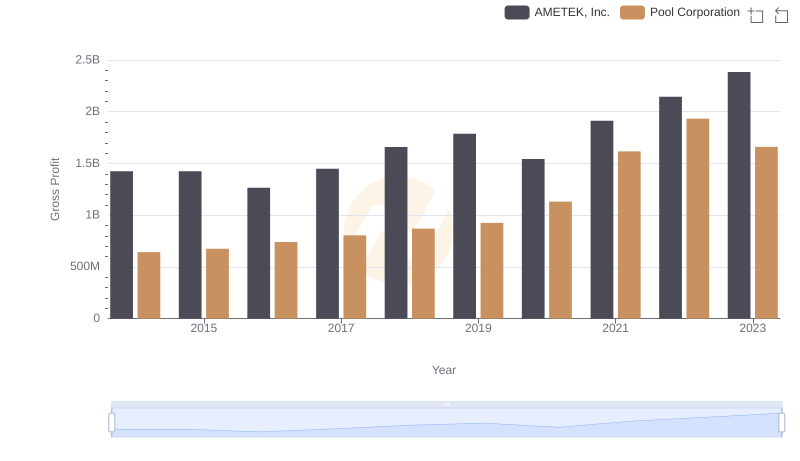
AMETEK, Inc. vs Pool Corporation: A Gross Profit Performance Breakdown
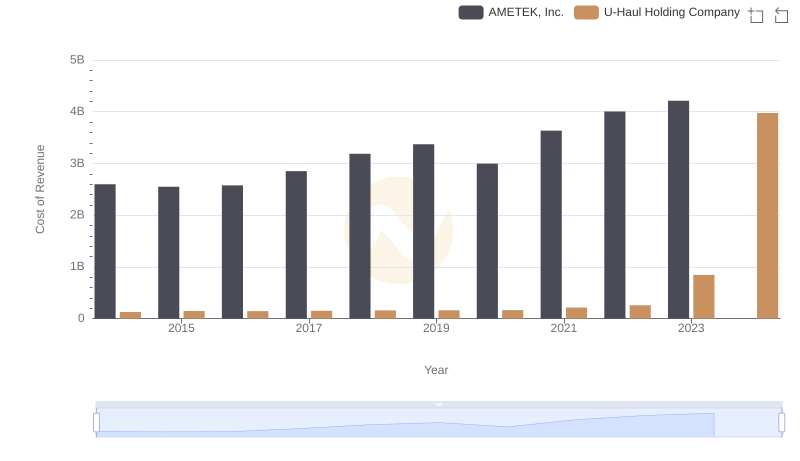
Comparing Cost of Revenue Efficiency: AMETEK, Inc. vs U-Haul Holding Company
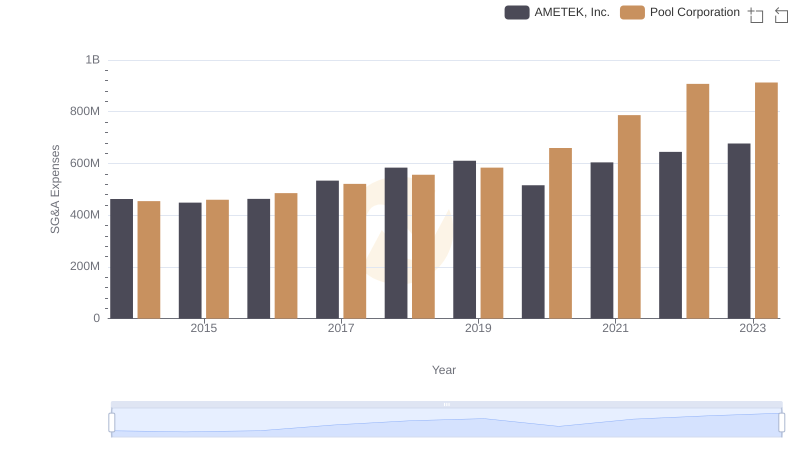
Cost Management Insights: SG&A Expenses for AMETEK, Inc. and Pool Corporation
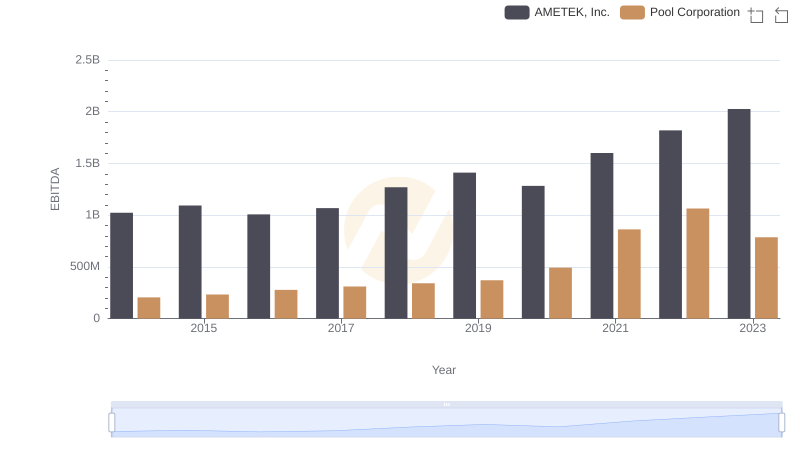
Professional EBITDA Benchmarking: AMETEK, Inc. vs Pool Corporation