| __timestamp | AMETEK, Inc. | Pool Corporation |
|---|---|---|
| Wednesday, January 1, 2014 | 4021964000 | 2246562000 |
| Thursday, January 1, 2015 | 3974295000 | 2363139000 |
| Friday, January 1, 2016 | 3840087000 | 2570803000 |
| Sunday, January 1, 2017 | 4300170000 | 2788188000 |
| Monday, January 1, 2018 | 4845872000 | 2998097000 |
| Tuesday, January 1, 2019 | 5158557000 | 3199517000 |
| Wednesday, January 1, 2020 | 4540029000 | 3936623000 |
| Friday, January 1, 2021 | 5546514000 | 5295584000 |
| Saturday, January 1, 2022 | 6150530000 | 6179727000 |
| Sunday, January 1, 2023 | 6596950000 | 5541595000 |
| Monday, January 1, 2024 | 6941180000 |
Unleashing insights
In the ever-evolving landscape of industrial and consumer markets, AMETEK, Inc. and Pool Corporation have carved distinct paths over the past decade. From 2014 to 2023, AMETEK, Inc. has seen its annual revenue grow by approximately 64%, while Pool Corporation has experienced a remarkable 147% increase. This growth trajectory highlights the resilience and adaptability of these companies in their respective sectors.
AMETEK, Inc., a leader in electronic instruments and electromechanical devices, started with a revenue of around $4 billion in 2014, reaching nearly $6.6 billion by 2023. Meanwhile, Pool Corporation, the world's largest wholesale distributor of swimming pool supplies, saw its revenue rise from about $2.2 billion to over $5.5 billion in the same period.
These figures underscore the dynamic nature of these industries and the strategic maneuvers that have propelled these companies forward.
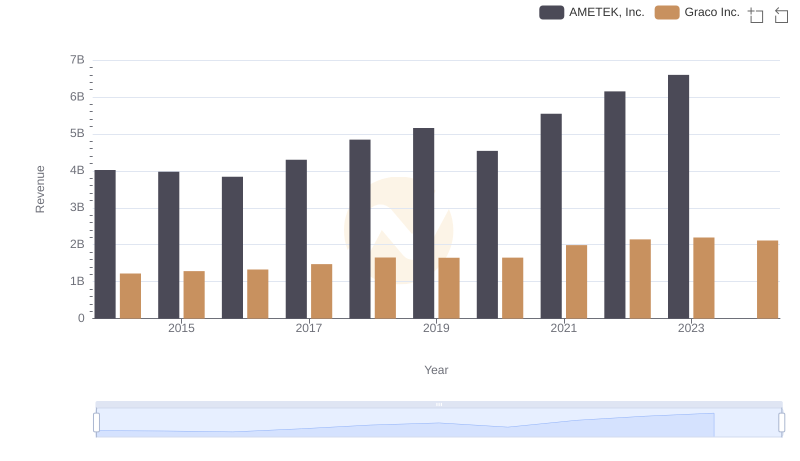
Annual Revenue Comparison: AMETEK, Inc. vs Graco Inc.
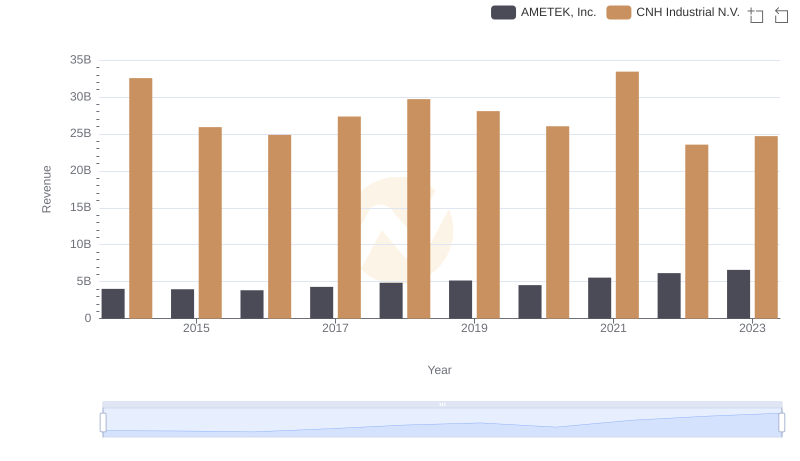
AMETEK, Inc. and CNH Industrial N.V.: A Comprehensive Revenue Analysis
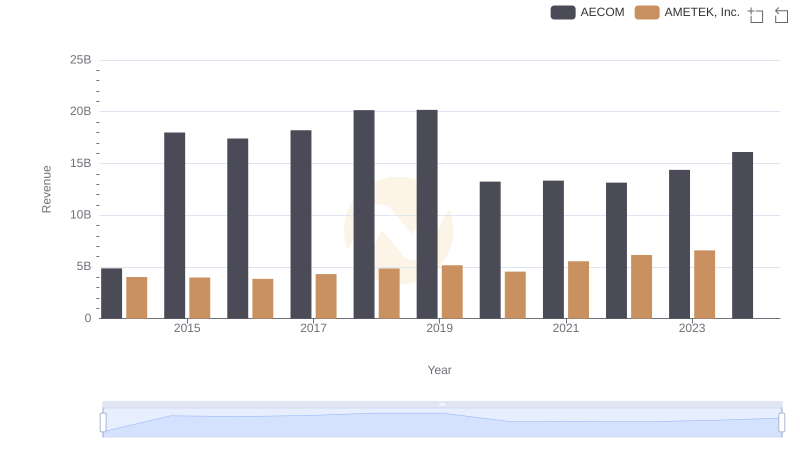
Who Generates More Revenue? AMETEK, Inc. or AECOM
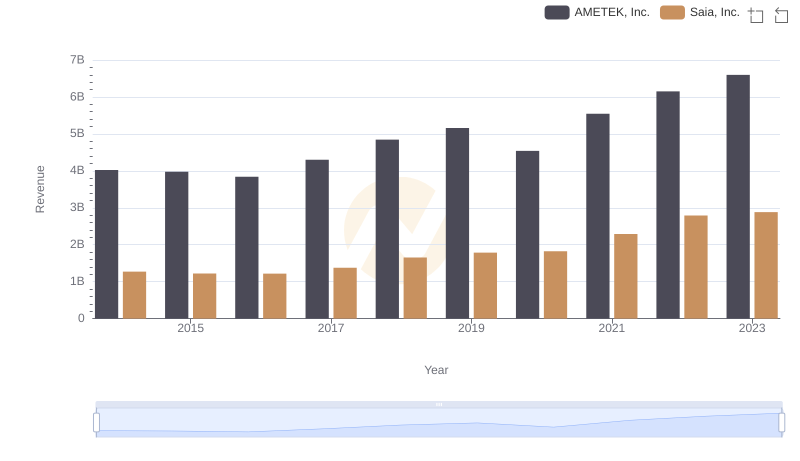
Revenue Showdown: AMETEK, Inc. vs Saia, Inc.
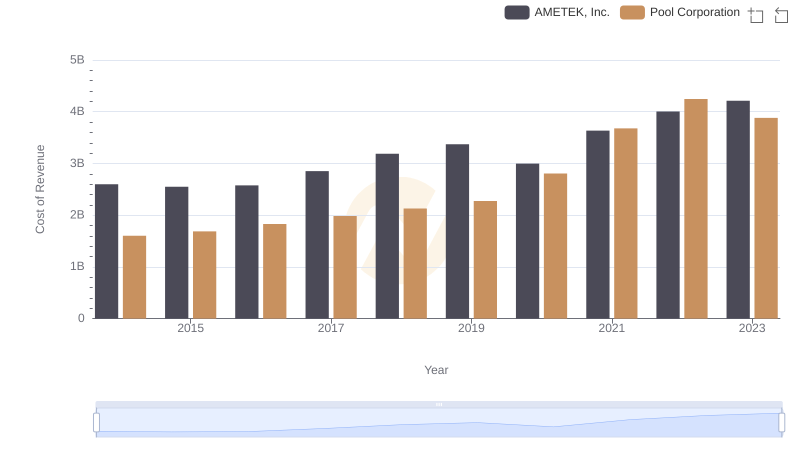
Cost of Revenue: Key Insights for AMETEK, Inc. and Pool Corporation
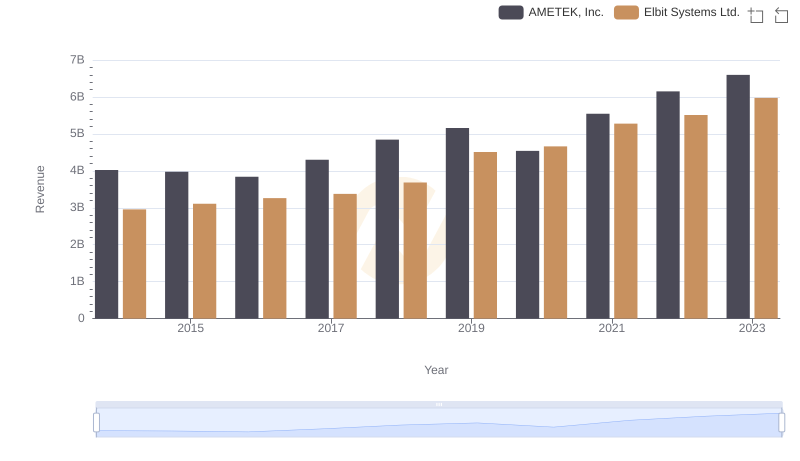
Revenue Insights: AMETEK, Inc. and Elbit Systems Ltd. Performance Compared
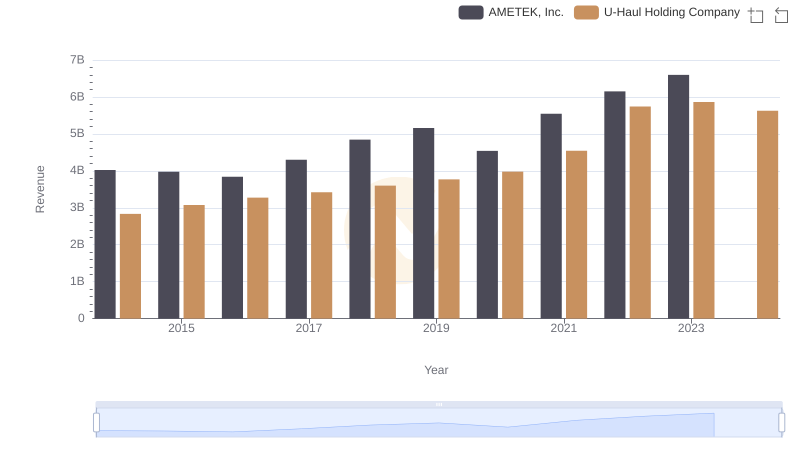
AMETEK, Inc. vs U-Haul Holding Company: Annual Revenue Growth Compared
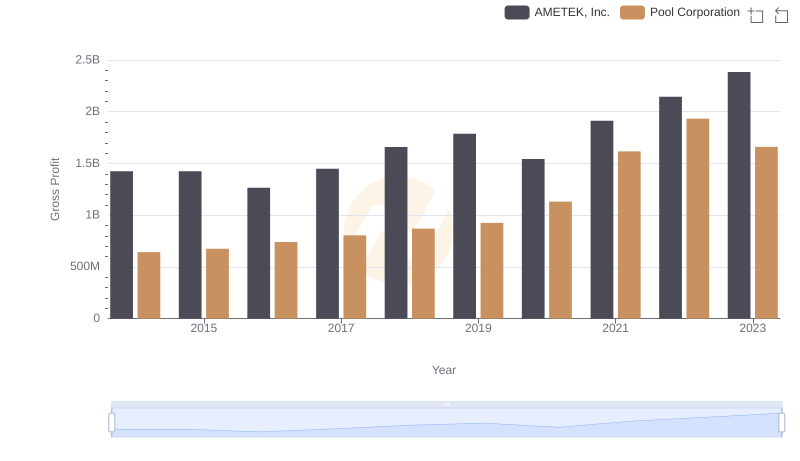
AMETEK, Inc. vs Pool Corporation: A Gross Profit Performance Breakdown
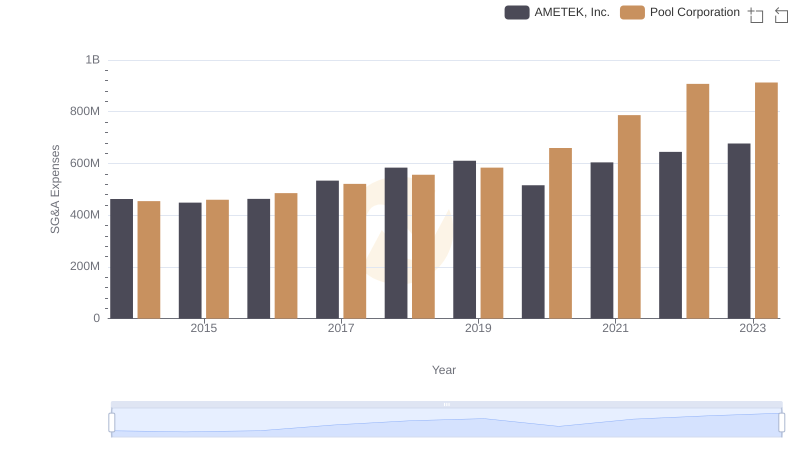
Cost Management Insights: SG&A Expenses for AMETEK, Inc. and Pool Corporation
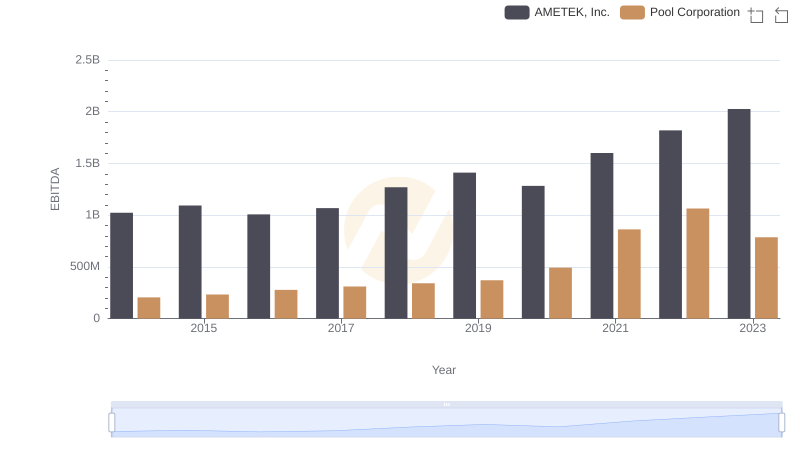
Professional EBITDA Benchmarking: AMETEK, Inc. vs Pool Corporation