| __timestamp | AMETEK, Inc. | Pool Corporation |
|---|---|---|
| Wednesday, January 1, 2014 | 1424947000 | 643340000 |
| Thursday, January 1, 2015 | 1425015000 | 675644000 |
| Friday, January 1, 2016 | 1264867000 | 741087000 |
| Sunday, January 1, 2017 | 1448739000 | 805289000 |
| Monday, January 1, 2018 | 1659562000 | 870173000 |
| Tuesday, January 1, 2019 | 1787660000 | 924925000 |
| Wednesday, January 1, 2020 | 1543514000 | 1130902000 |
| Friday, January 1, 2021 | 1912614000 | 1617092000 |
| Saturday, January 1, 2022 | 2145269000 | 1933412000 |
| Sunday, January 1, 2023 | 2384465001 | 1660044000 |
| Monday, January 1, 2024 | 6941180000 |
Unlocking the unknown
In the competitive landscape of industrial and consumer goods, AMETEK, Inc. and Pool Corporation have demonstrated remarkable financial resilience over the past decade. From 2014 to 2023, AMETEK, Inc. has seen its gross profit soar by approximately 67%, peaking at $2.38 billion in 2023. This growth underscores AMETEK's strategic prowess in navigating market challenges and capitalizing on opportunities.
Meanwhile, Pool Corporation, a leader in the pool supply industry, has also experienced significant growth, with its gross profit increasing by around 158% over the same period, reaching $1.93 billion in 2022. Despite a slight dip in 2023, Pool Corporation's long-term trajectory remains robust.
This performance breakdown highlights the dynamic nature of these industries and the companies' ability to adapt and thrive, offering valuable insights for investors and industry analysts alike.
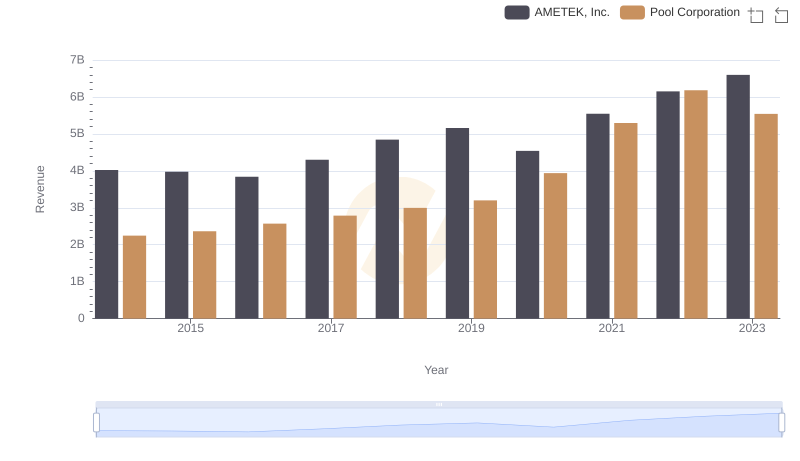
AMETEK, Inc. vs Pool Corporation: Annual Revenue Growth Compared
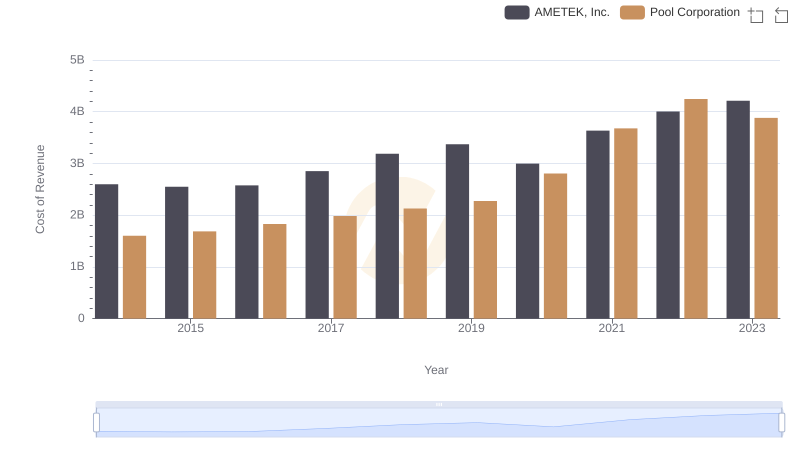
Cost of Revenue: Key Insights for AMETEK, Inc. and Pool Corporation
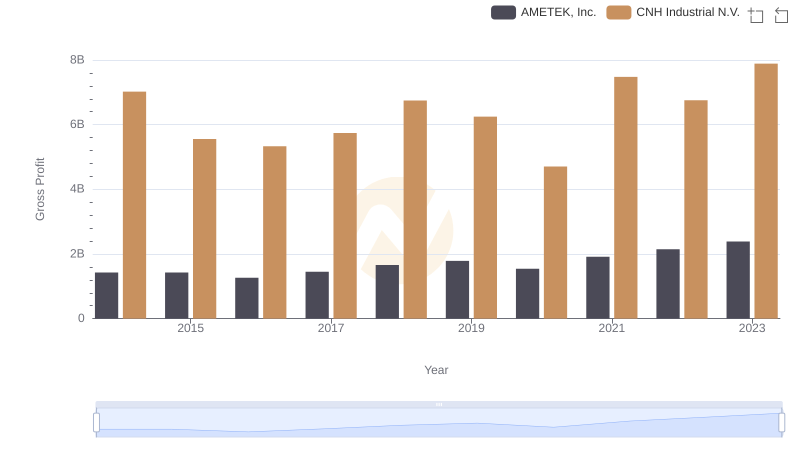
Gross Profit Trends Compared: AMETEK, Inc. vs CNH Industrial N.V.
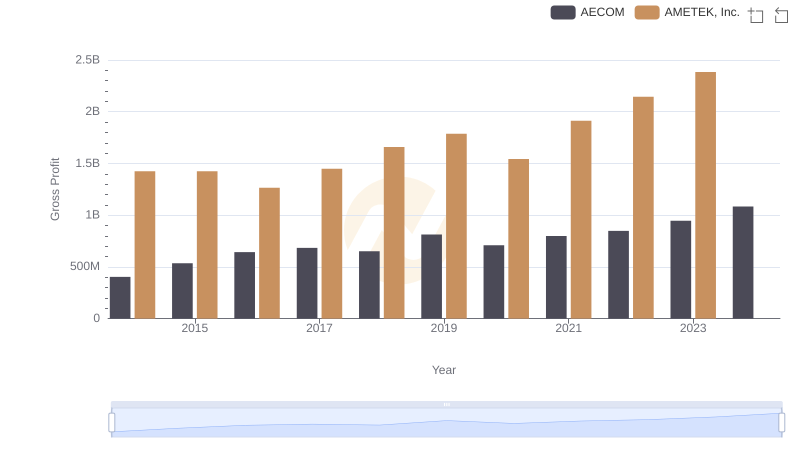
Gross Profit Trends Compared: AMETEK, Inc. vs AECOM
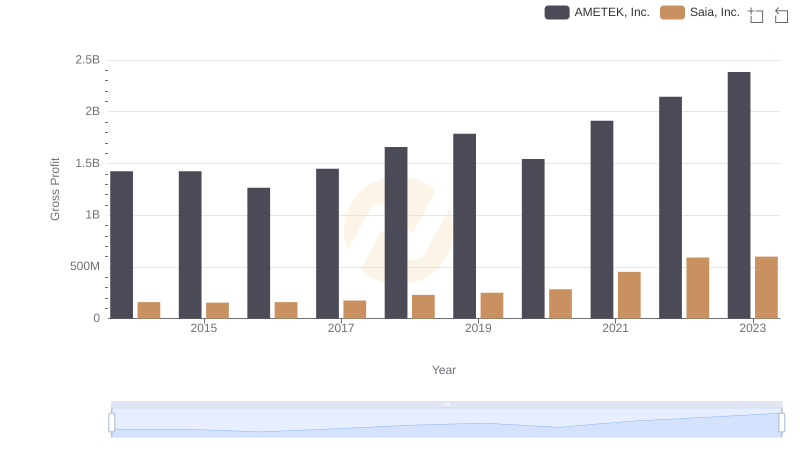
Gross Profit Trends Compared: AMETEK, Inc. vs Saia, Inc.
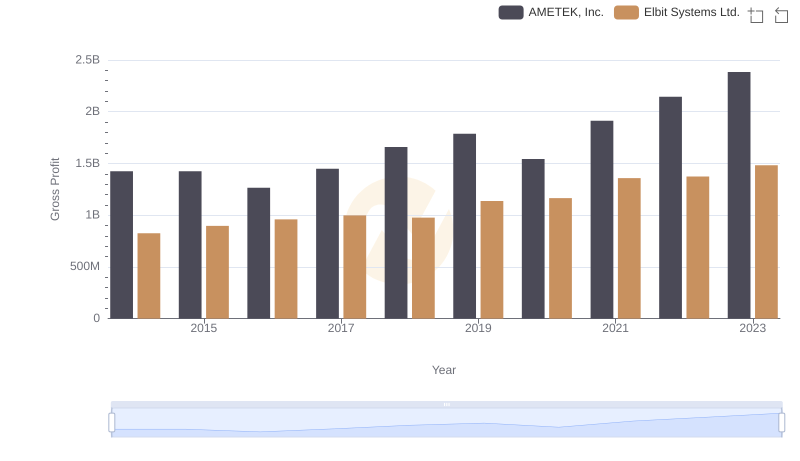
Key Insights on Gross Profit: AMETEK, Inc. vs Elbit Systems Ltd.
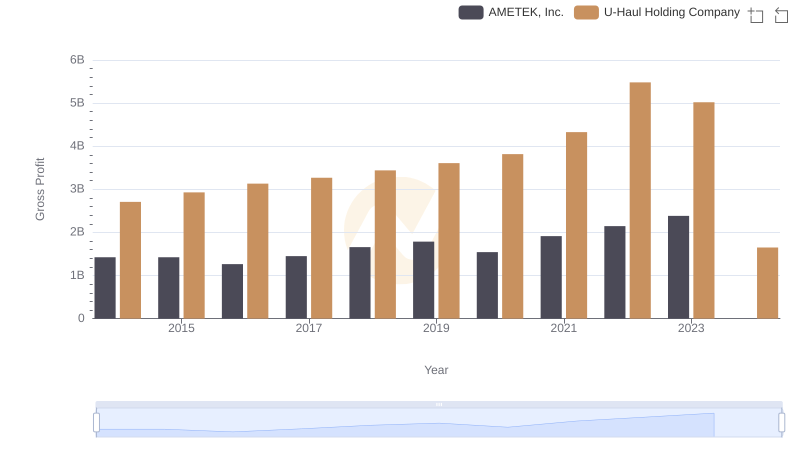
AMETEK, Inc. vs U-Haul Holding Company: A Gross Profit Performance Breakdown
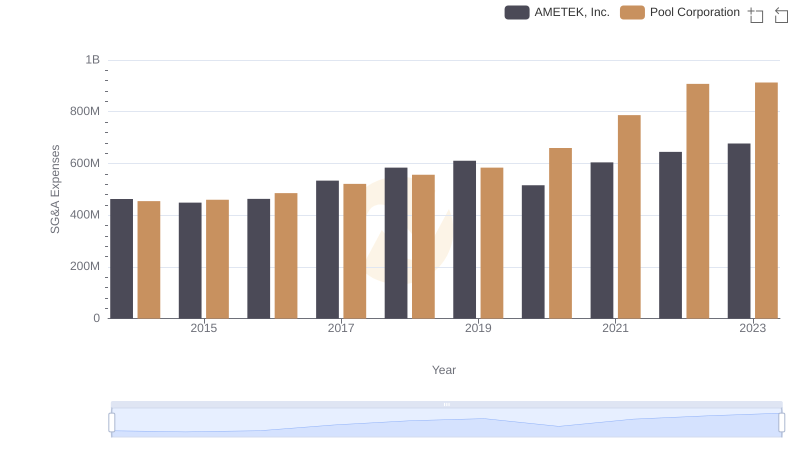
Cost Management Insights: SG&A Expenses for AMETEK, Inc. and Pool Corporation
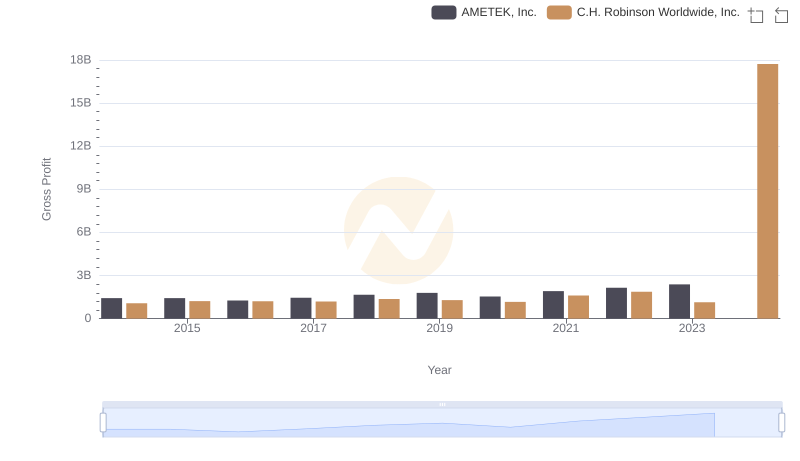
Gross Profit Analysis: Comparing AMETEK, Inc. and C.H. Robinson Worldwide, Inc.
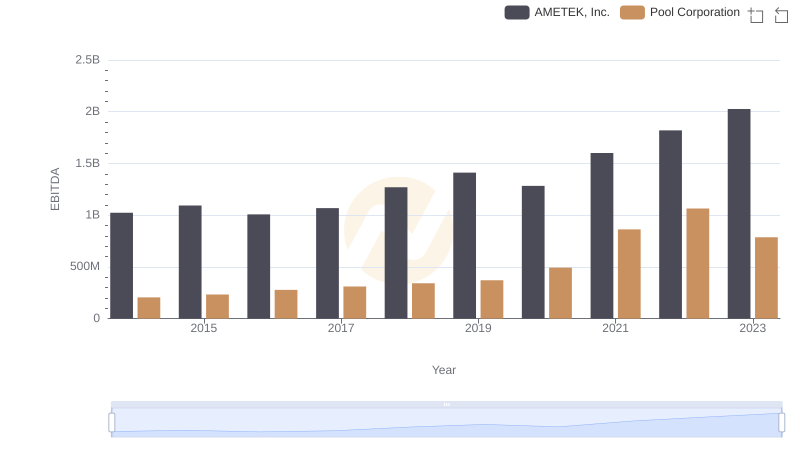
Professional EBITDA Benchmarking: AMETEK, Inc. vs Pool Corporation